For most of my adult life, the government department responsible for the supply of teachers, whether it was called the DfE, DES, DfEE or by another name, has used a version of the Teacher Supply Model to calculate future teacher needs, and presumably to ensure the government doesn’t waste money training too many teachers.
Training too few teachers, not as a result of the Model, but because of under-recruitment into training, has been a problem for the Teacher Supply Model (TSM) during periods of teacher shortage. Do you either add the under-recruitment to the TSM target in any one year to the next year’s TSM total, thus making it even harder to reach, or do you accept every school starts each new school year in September fully staffed, so there are no vacancies to be filled, even if additional trainees just happened to be recruited. Over the past forty years, both approaches have been tried: neither really works.
I first came across the TSM in the late 1980s when, in response to a Select Committee Report, a technical document explaining the working of the TSM at that time was published. Between the late 1980s, and a seminal announcement, also to a Select committee, by David Laws when he was the Minister of State that the TSM would be part of open government, the TSM remained largely secret, apart from one other document published in the late 1980s in repose to yet another two Select Committee reports.
Why were successive government keen to keep the TSM under wraps? Possibly because the workings allowed for an understanding of future government policy. There are three obvious areas where changes in policy can have consequences for schools and society that might create political debate: reactions to future pupil numbers, whether up or down; changes in education funding that might allow more or less funds for schools; policy changes such as extending the learning leaving age or the introduction of a new subject, such as citizenship or computing. All impact on the TSM
Governments often don’t want to signal policy changes ahead of time, especially if they might be controversial. In the first decade of this century, the secrecy around the TSM almost caught out the ITT sector when falling rolls together with improved ITT recruitment made a reduction in ITT numbers inevitable for secondary subjects, especially as there was no policy around improving staffing levels in the secondary sector, partly because of the decision over the introduction of non-contact time in the primary sector.
Planning is an essential too of any organisation, including governments, whatever extreme free-market thinkers may say. After years of following the consequences of the TSM decisions on the outcomes for the teacher labour market, I have some concerns about what happens when the TSM has been run for any particular year. The elements of the TSM have changed over the years, as explained above in relation to under-recruitment as an example. That’s not an issue for me, although the discussions with the sector may have helped prevent some changes to the TSM in mor recent times.
What is at the core of my concerns about the TSM is the length of time between the collection of the data for input into the TSM and the consequences for the real-time labour market for any September recruitment round, let alone the needs for teachers to fill any January vacancies.
I acknowledge that improved and faster data collection over time thanks to better computing capabilities has helped reduce the time taken between data collection and the effect on the labour market of the TSM output for any recruitment round. Currently, data from the 2025 School Workforce Survey, collected in November 2025, will probably influence the TSM run for the 2027 entry into training, and hence, the 2028 labour market.
At least with most trainees now on a one-year postgraduate training route, there is no longer the issue of a four-year undergraduate course to add into the mix. The November 2025 data collected, if such courses were still a significant part of the ITT scene, would not affect the labour market until 2031. A lot can happen in the intervening years.
Even with the shorter training period, there is still a time lag between data collection and the consequences of that data on the labour market.
My question is, should a further check be added once the TSM has been used to calculate ITT targets, in order to allow the comparison between the TSM target and the current reality of the labour market?
The DfE now has excellent data from several years of operating its own vacancy platform, and there are also private operators monitoring the labour market with useful vacancy data in real time. This data can be compared with the TSM output target to allow a discussion about the validity of the TSM target to current labour market needs.
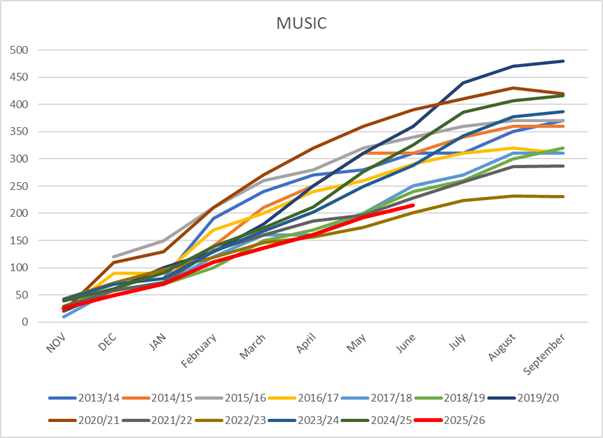
Now, it may well be that the TSM number is the best fit for training needs, but as my previous post that considered the labour market data for teachers of music alongside the ITT target cut that presumably emerged from the TSM output has suggested, the addition of vacancy data does allow for a debate about whether the TSM target under or over estimates demand. Music ITT: has the government made a mistake? | John Howson
Such use of vacancy data also allows for a consideration of policy changes, such as how schools react to a change in a market where QTS still allows any teacher to teach any subject to any child, and ‘permits the use of unqualified staff. where nobody with QTS is either available or considered sufficiently expert at delivering the curriculum.
The TSM isn’t outdated, just, in my opinion, no longer enough by itself to ensure an orderly labour market for teachers.
Why is this important, it is because the market does play a part in determining how shortages are dealt with. Where are the qualified teachers of physics teaching? How much more do schools with high levels of free school meals have to spend on recruitment than a school with fewer such pupils? Important questions around the staffing of the nation’s schools.
I read the Fed report on education issued yesterday National Education Report 2026 – FED and believe that the supply of teachers and school leaders is still at the heart of any effective system of education.
How any government determines teacher supply is a vital decision affecting the lives of many young people. Ensuring every child has the best possible teachers throughout their whole school-life is equally as important as whether or not they are banned from social media, but much less often discussed.
I think that teacher supply issues should be much higher up the education agenda, but I would, wouldn’t I, having spent a career worrying about teacher supply matters.