‘PedXing’, and ‘this way for the nuclear bunker’

August is known as the silly season. It is also the holiday season in the northern hemisphere. So, perhaps not surprisingly, this blog is having a bit of a holiday from writing just about education.

This post is being written from Dubai, so why the headline? Well, when I first visited the USA ,in the summer of 1968, these were the two signs that I saw that stuck in my mind. The first, because we have no word sign for pedestrian crossings in the United Kingdom at that time, the transport Ministry preferring pictograms. The second because, although only a couple of years after the Cuban Missile crisis, there were no signs in Britain of what people should do if the threat of nuclear war became a reality. Were the British just more phlegmatic, or just further away from the action? I suppose an ICBM from the USSR could have hit New York, and in the UK were were still more concerned about the threat of a conventional war. In the late 1960s, the British Armed forces still had over 50,000 troops stationed in Germany in case of a threat from the East.

As an aside, that threat in the summer of 1968, while I was in North America, came when Russian troops invaded what was then Czechoslovakia and put an end to the ‘Prague Spring’. In the USA, the threat turned out to be internal, not least to the Democratic Party with assassinations, and the riots outside the Democratic Party’s convention in Chicago.

But, back to the point of this post. After three days in Dubai and a visit to Fujairah, another Emirate in the UAE on the Gulf of Oman, I have seen no signs of either anxiety about what has been happening in the Gulf for the past six months, nor any warning to the population of what to do if there was a drone or missile attack. All feels exactly as it has been on my other visits to Dubai, the last of which was a recently as 2024. The building boom goes on, with ever more extravagant design for high rise buildings: bits chopped ot, bridges connecting two buildings at a high level, and almost any other non-functional design you can image, and a few you probably cannot.

To add an education note; the UAE, and especially Dubai is an important location for British-style schools, many independent schools have offshoots here, free from the demands of the VAT-person. There is also the offshoot of one state school: something I wrote about earlier. see What is the role of the State in schooling? | John Howson There are also many schools for the nationals from the Indian sub-continent that make up much of the workforce in Dubai where employees have been able to bring their families.

i did wonder whether I should have tried to export Drone Football as a new game on the back of the World Cup, but this was a holiday, so perhaps that’s for another time. If you are interested, drop me a note in the comments and I will put you in touch with the organisers of the game in Oxfordshire.

Are teachers better paid?

Way back in 2014 I wrote a post that attracted a significant number of views Be a teacher: earn £12-15 per hour? | John Howson (More than 1,500 in the month it appeared, and many more since).

As August is often a slack time for new data, I thought it would be interesting to see how teachers have fared financially since I originally wrote that post in 2014.

Interestingly, the government view of teachers no doubt helps to define the profession in the public mind, and that of some journalists and commentators, as one that doesn’t need to work very hard to earn a living. Hence the following statement for ‘Employee Earnings in the UK: 2025’

  1. Full-time is defined as employees working more than 30 paid hours per week (or 25 or more for the teaching professions). Employee earnings in the UK – Office for National Statistics

I don’t find that helpful, even though it is the minimum and it flies in the face of the DfE’s own diary research. See Working lives of teachers and leaders wave 4: qualitative report – GOV.UK and Working lives of teachers and leaders wave 4 research report page 24 that contains the following:

Hours worked

Teachers and leaders both reported working fewer hours on average in their most recent full week of work in 2025 compared with all previous years (Figure 3.1).

Average weekly working hours were as follows:

• leaders: 55.5 hours, down from 56.6 in 2024, 57.4 in 2023 and 56.8 in 2022

• teachers: 46.9 hours, down from 48.1 in 2024, 49.4 in 2023 and 48.7 in 2022

Among leaders, this pattern was driven by those working full time in particular (56.5 hours vs. 57.6 in 2024, 58.2 in 2023 and 57.5 in 2022), while for teachers, average hours were lower among both those working full time and those working part time.

The good news is teachers, and school leaders, are working fewer hours; the bad news is that they are still working nearly a 10-hour day during term-time. Why should the government still set the starting benchmark for a full-time teacher at 25 hours?

Anyway, assuming teachers work for 195 days a year (190 with pupils and 5 other statutory working days) and ten hours a day, to include the weekends, and that make 50 hours a week, close enough to the 46.9 hours of the diary study.

In September 2026, a teacher at the bottom of the scale, on M,1 will be paid £34,069 if working outside the London pay zone. This equates to £17.60p per hour for the 1950 hours.  Now assume that the average teacher does some ‘work’ in the remaining 13 weeks. School trips, CPD, preparation for next year, turning up at school on two exam results days, reading the tes or schoolsweek each week in order to keep informed, all adds up to work. Assuming seven weeks of work at an average of two hours per day, add an extra 70 hours to the total, bringing it to 2060 hours, and a rate of £16.60 per hour. That leaves six week for holidays, similar to most other public servants if you include public holidays.

Now the minimum hourly wage in England for an adult has been £12.71p since the 1st April 2026. So, a new teacher, at the bottom of the scale starts at around £4 per hour above the minimum wage. I assume the Low Pay Commission that recommends the minimum wage likely doesn’t take into account repayment of student debt when calculating the rate for the Minimum Wage. Teachers will, in many cases have accrued four years of student debt thy need to service straightaway at the starting salary of £34,069p. For those on Plan 5, this could reduce their income by around 40-50p per hour, reducing the hourly rate to just over £16.00p.

Is it time to review the Teachers’ Pay and Conditions to make much clearer what teachers being paid to do, and what they should either expect additional payments for undertaking the work, or genuine time off in lieu. No longer can teaching operate some unofficial form of ‘employer-driven flexitime’ that is little changed from when I joined the profession as a teacher in 1971.

Finally, anyone being pay on the Unqualified Teacher rate at the bottom of the scale, might be receiving a salary much closer to the Minimum Way. If they have an annual contract that means they need to work similar hours to their qualified colleagues, then they might even be being paid below the Minimum Wage: perish the thought.

So, enjoy August and ask yourself, are you being paid for the time you are spending on school work and furthering your career? How much might you charge per hour for tutoring?

Mbacc a pipedream without the teachers

In the previous post, I considered trends in teacher supply into state secondary schools for three subjects listed as a part of the Prime Minister’s proposed MBacc. If such a qualification is to be rolled out nationally, then there will either need to be more teachers in schools in certain subjects or more young people will need to be diverted into further education, perhaps at 14 rather than 16. However, even that strategy won’t solve the music and performing arts dilemma regarding the number of teachers’ issue. Abolishing the bursary for music looks even more unfortunate in the light of the MBacc announcement.

How about the wider primary and secondary sectors?

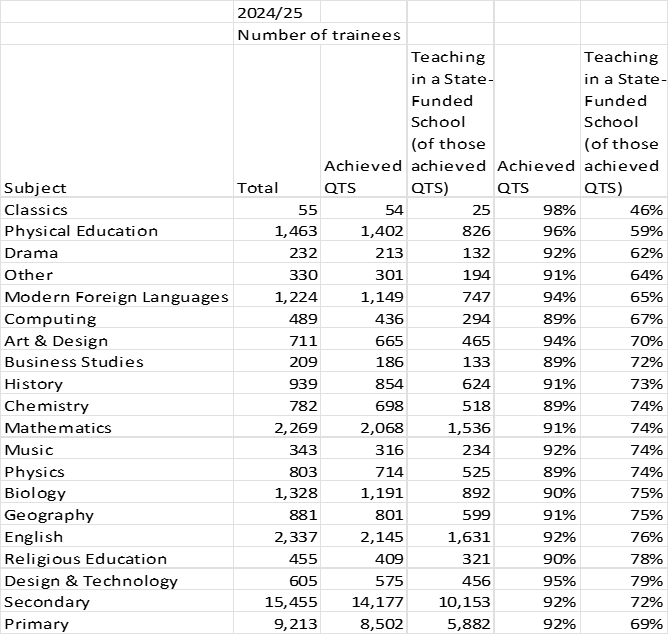
 In line with falling pupil numbers, there has been a reduction in trainee numbers in the primary sector. This has resulted in fewer numbers obtaining QTS, and even fewer of those working in the state primary school sector. The 5,882 recorded working in state schools of the 2024/25 cohort should increase as the data is refined, but it is still likely to be only halfthe number of just four years previously, when more than 10,000 new teachers were working in the primary sector at some point in the 16 months after obtaining Qualified Teacher Status (QTS).

Fortunately, those newly qualified teachers not obtaining a teaching post in England, might be able to look overseas for work. With VAT on fees for private school pupils in England, the independent sector is unlikely to offer must of an alternative to the state sector over the next few years; at least until there is some upturn in the birthrate.

I hope that course providers will take note of this data, and not over-recruit to courses in the future, as burdening students with more debt and a restricted chance of securing a teaching post is not really fair on the students.

In the secondary sector, the overall position hides some variations between subjects.

The percentage obtaining QTS among secondary trainees has been falling; from some 95% before covid, to 92-93% in the years since. The overall percentage hides a much greater change in the numbers obtaining QTS, from a Covid high of 19,070 to a low of 12,820 only two years later. Covid may have brought forward the decision to teach that might otherwise have been delayed until a future year.

Fortunately, 2024-2025 saw the number obtaining QTS much closer to pre-Covid levels. With falling rolls, the overall number of trainees, if not the mix within subjects, may be satisfactory for the DfE.

However, post-covid the state school sector lost around five and a half thousand teachers compared with the pre-covid numbers f new teachers entering state schools. To what extend these missing teachers have been replaced by new entrants through the ‘assessment only’ route, isn’t clear from the data.

In the most recent year, 2024-2025, what of the percentages in state schools by secondary subjects?

The low percentage of those qualifying for QTS in Classics instate schools, is perhaps not a surprise given the percentage of state schools that teach the subject. The fact physical education is in second position in the table, with just 59% of those obtaining QTS in state schools should not be a surprise to anyone familiar with the number of trainees recruited and the DfE’s target for the subject.

Only in English and mathematics were there more than 1,000 new teachers working in schools. Given the requirement to teach these subjects to all pupils up to Year 11, and for some in Years 12 & 13, even these numbers may be insufficient. The 234 music, and 133 business studies teachers, and the 321 religious education new entrants, are almost certainly not enough to allow the subjects to thrive in our schools, even before the desire to widen the curriculum to include more MBacc students, and fewer EBacc students.

Alongside the conversation about the curriculum, and the desire of the Prime Minister to make it more relevant for work in the 21st century, there really needs to be a conversation about how the curriculum changes can be properly staffed, so that all pupils receive a high quality education taught by teachers qualified in their subject, and not just a page ahead of the AI generated lesson plan.

Data from: Initial teacher training performance profiles: 2024 to 2025 – GOV.UK

Are teachers paid a fair wage for being a graduate?

Last week, the DfE published the latest report from the School Teachers Review body (STRB) School Teachers’ Review Body – THIRTY-SIXTH REPORT – 2026 This is the 36th Report from this body. Its recommendations on pay were accepted by the Secretary of State.

While the headline increases in pay, in percentage terms, seem generous, in reality they are part of a catching up exercise of a similar type to that which caused the hard-fought battle with resident doctors in the NHS.

Here’s what the STRB said about teachers’ pay over the past decade and a half:

The real-terms value of median teacher earnings has fallen since the early 2010s. The fall in real teacher pay has been greater than that for other professional occupations.

• When comparing teachers’ pay to that of other professional occupations by age and region using data from the SWC and the ONS, teachers fell below the comparators in all groups. The gaps between median teacher pay and that of other professionals was greatest in London.

• Based on proprietary benchmarking data, starting pay for teachers is between the lowest quartile and median for roles of comparable size and scope.

These three comments seem to justify the pay rise, and it is not a generous settlement in a vibrant labour market for graduates. If that market cools between now and 2027, possibly because of the effects of AI on entry level jobs, it will be interesting to see what the next STRB pay report suggests.

The STRB summed up the situation in the most recent period as follows:

In 2024-25, for the Rest of England and London, teachers’ median earnings were below those of the comparator groups for all age bands. The gaps between teachers’ earnings and those of the comparator group were greatest in London.

Across most age categories, the relative earnings of teachers deteriorated from 2014-15 to 2019-20, both in the Rest of England and London. After a slight improvement in 2020-21 during the COVID-19 pandemic, this downward trend for relative earnings continued across all age categories to 2023-24. Over the latest period, between 2023-24 and 2024-25, the relative earnings of teachers have slightly improved, although their median earnings remain below other professional occupation counterparts.

Overall, teachers aged 21 to 30 compared least favourably against the other professional occupations, both in the Rest of England and in London. Those in the oldest age group (over 60) compared most favourably, although are still behind relative earnings of those in other professional occupations. Page 70

In summery the STRB concluded that;

Our analysis of real-terms pay changes over time suggests that the competitiveness of teachers’ earnings compared to the whole economy, wider public sector and to professional occupations, was lower in 2024/25 compared to 2010/11. Figure B.10 shows how the real-terms value of teachers’ median earnings fell throughout the early 2010s. The chart shows there was some improvement for teachers between 2018/19 and 2020/21, prior to the pay pause in 2021/22, and a period of decline to 2023/24. There was some improvement in 2024/25, however we estimate that teachers’ median gross earnings in 2024/25 were 13.9% below their level in 2010/11 in real terms. Median gross earnings for the whole economy were 0.6% below their 2010/11 level, whilst median gross earnings for professional occupations were 9.2% below their 2010/11 level, in real terms. Page 71

One issue potentially facing the STRB could be the problem of a single pay scale for all teachers when the labour markets for primary and secondary school teachers are operating in very different ways. However, it would be a brave government that tackled this issue. Most likely, a move on allowances, and how they are offered, could be the obvious way to tackle over-supply in the primary school labour market, and areas of shortage in the secondary school teacher labour market.

The STRB had something to say about the axing of bursaries from some ITT subjects.

111. The number of bursaries available for 2026/27 has been reduced across a range of subjects, with others seeing a reduction in the bursary value. The bursary values for Biology and Geography are both down by 21,000, while Modern Foreign Languages and Design Technology are down by 6,000. Art, Music and Religious Education are down by 10,000 to zero, with English down by 5,000 to zero. We also note that for Business Studies, Music, Religious Education, Modern Foreign Languages and Design Technology, the reduction in bursary value coincides with the failure to reach target entrant numbers in 2025/26. P101 My emphasis

There is also an interesting table (B21) that provides evidence to support my posts over the past year querying why music and also Religious Education lost their bursaries. Pages 100 to 102, and especially table B21, where music and Religious Education were placed in the top three subjects for the lowest percentages of ITT placed filled, provide cogent evidence for the need for an explanation as to how bursaries are allocated to different subjects?

I think the STRB are sending a coded message to the DfE in this report about the lack of bursaries in some of the subjects that struggle most to recruit. The DfE’s answer, backed by HM Treasury, would no doubt be that there are few graduates in these subjects to entice into teaching, so the bursary would be paid to those already choosing teaching as a career. Funny how that argument doesn’t work for physics or mathematics.

A couple of other interesting nuggets for the STRB report:

• In 2024/25, male teachers had higher earnings overall than female teachers across all school types. Median earnings were higher in secondary schools than in primary and nursery schools.

• Based on proprietary benchmarking data, starting pay for teachers is between the lowest quartile and median for roles of comparable size and scope. …. The comparative basic salary position of leadership roles in primary schools is generally below the market base salary data, whilst roles in secondary schools are better aligned to the market base salary data.

• The full-time equivalent (FTE) teacher workforce decreased by 0.1% or 432 between 2023 and 2024. Secondary schools once again saw the largest absolute increase in teacher numbers.

• The proportion of teachers from an ethnic minority background remained stable, with 89% of teachers across state-funded schools being white. The proportion of white teachers is higher in nursery and primary schools than in secondary schools and increases with seniority in leadership roles.

Finally, a word about leadership pay. The STRB concluded that:

2.25 The comparative salary position of leadership roles in primary schools falls below the market salary data in all regions, whilst leadership roles in secondary schools are better aligned to the market salary data. P11

After a year of tracking headteacher vacancies, I do wonder why anyone would take on a job both teaching and leading a small primary school for a salary of little more than £60,000 from September when a classroom teacher with no responsibilities, and a similar length of service could be earning nearly £53,000.

Little more than £10,000 extra, for both the loss of the 1,265 working time protection and all the extra responsibilities, seems like a gross imbalance in differentials. This is especially the case when all primary leaders, and not just headteachers, work on average 5.1 hours more than classroom teachers. Table B14 page 91.

I will say more about the issue of headteachers’ pay when I publish my review of headteacher vacancies for 2025-26 at the end of August.

The saviour for the government when considering future pay is ‘falling pupil numbers’. This issue makes the need to recruit teachers, especially with the current age distribution of those teachers in employment less of an overall challenge.

However, as indicated earlier in this post, dealing with the consequences of different primary, secondary and further education labour markets may be a real issue for the next STRB Report.

Exporting education: still a success story

The DfE has published the latest annual report in the success of education as a contributor to the nation’s wealth through exporting educational goods and services. This includes both selling and providing services , and the provision of services within the United Kingdom. Of the latter, UK Higher Education is the major earner.

I have written about trends from previous reports, but not for some time.  Making money from Education | John Howson In 2021 the DfE changed the methodology for collecting the data. This year, in the report figures for 2021 and onwards are presented using the new methodology only. Release home – UK revenue from education related exports and transnational education activity – Explore education statistics – GOV.UK

The latest data are for the year 2024. The report notes that

total UK education related exports and TNE activity was estimated to be £36.7 billion in 2024, an increase of £7.2 billion in nominal terms since 2021. Over the same period, in nominal terms, education related exports have increased by £5.8 billion while TNE activity has increased by £1.4 billion.

This is a good news story, although not all sectors have performed as well as in the past. Both further education and English Language training recorded improvements over the previous year, although further education fee income was down on the previous year, and both sectors had much higher earnings a decade ago, before covid.

As the report notes: ‘Higher education exports grew by £0.1 billion (0.5%) from £26.4 billion to £26.6 billion between 2023 and 2024. The low growth rate in HE exports can partly be attributed to the reduction in international HE student enrolments since 2022/23.’

This low growth rate must be a worry for the future as this has traditionally been such a key source of income from both fees and living costs.

 Between 2023 and 2024, schools’ exports grew by £0.1 billion (7.4%). This is good news for the economy, but a concern for state-funded schools if it diverts scarce teaching resources in subjects such as physics and mathematics away from upskilling pupils in state-funded schools to educate elites elsewhere in the world or in UK boarding schools.

Elsewhere, equipment sales grew from £0.20 Bn in 2021 to £0.37bn in 2024. During the same period, publishing income rose from £2.31bn to £3.15bn, and earnings from qualification awarding bodies, from £0.36bn to £0.51bn.

No doubt there is room for further growth along the lines of the export strategy Exports good, but the poor won’t be able to afford them | John Howson However, as I pointed out in my earlier post, there is also the contribution to development aid to consider alongside the income from exporting education goods and services. Sadly, as a nation we seem less interested in development aid these days.

What of the future? How will AI affect export opportunities, and will the nation’s attitude to those who are not natives cause a reduction in the significant higher education income if overseas students decide to go elsewhere to study. If that happens, will universities take their product overseas, or just retrench? How will our relationship with Europe affect education exports in the future, especially if there is a growth in Erasmus type programmes?

Finally, we do need to do more to help aspiring entrepreneurs starting out selling goods and services in the education field.

How about a university course for those wanting to start out in this field?

Tell me the old, old story: the working class and schools

With the publication later today of the Star Academy Trust commissioned report into outcomes for ‘white working-class boys’, I thought I would look at what I posted when the inquiry was announced last year. Class matters more than ethnicity | John Howson

However, I cannot help thinking that the focus of the inquiry is wrong. All the evidence suggests that of the three factors of race, gender and class, it is the third one that really matters. Yes, they are often inter-related, but looking at socio-economic data, it is often schools in deprived areas, regardless of the ethnicity of their pupils that fare less well in school performance table.”

Way back in 1982, nearly 50 years ago, I used some evidence from a book published in 1926 by Kenneth Lindsay, and entitled ‘Social Progress and Educational Waste’ about the wide variations in the percentages of children obtaining secondary education – not mandatory for all until 19944 – to discuss differences in provision for schooling across England. (Variations in Local Authority Provision of Education Oxford Review of education, Volume 8, Number 2, 1982). Lindsay, in his book, found one school in Lewisham that won as many scholarships to secondary school as the whole inner city area of Bermondsey out together.’ Differences in education by social class were commonplace.

In the 1960s, The Plowden Report into primary education found that ‘the boroughs in which expenditure [on schooling] was generally low were very much the same in 1960-61 as they were in 1950-51.’ Later that decade another report Half our Future looked at the children leaving school at 15. I celebrated its 50th anniversary with this blog post Half Our Future: A tribute | John Howson both Reports revealed the differences in outcomes for different social classes and how those gaps might be reduced.

Finally, in terms of evidence of the different education outcomes for different groups in society, it is worth reading the Oxfordshire County Council report to Education Scrutiny Committee of 16th October 2014 ESC_OCT1614R05 Educational Attainment of White Working Class Boys.pdf

So, don’t expect anything new, today, but I would like this report to be linked to the speech by Andy Burnham, also to be given today that should speak about the importance of ‘place’ and devolution in our society.  

Both Lindsay and Plowden wrote when schooling was a devolved activity, sometime described, at the time, as ‘a local service nationally administered’. Since then, the administration of schooling has become more site -based with schools operating their own budgets, but more nationally controlled from Westminster. This shift in ‘place’ doesn’t seem to have done much for the educational achievements of white working-class boys.

So, will a shift back to more local or regional decision-making move on the dial for outcomes? Much, I think depends on the interplay of the 4 ‘P’s of Education power

Parents

Premises

People

Purpose

And how they operate together.

The Conservatives, after the 2010 general election had ideas, but they didn’t work for those not wanting to go on to high education. Interestingly, although academies were free from following the National Curriculum, few looked at whether it was appropriate as a curriculum for their communities.

However, what is common to all places is the vital need to engage with effective early learning. If all young people achieve successful early in life, then, with the building blocks firmly in place, more can be achieved later. Fail early, fail often in schooling, and with failure comes disillusion and a lack of engagement.  

So, let’s continue the battle to achieve success in education for all, but it won’t be easy, and will need a view of ‘place’ that incorporates local, regional and national policy-making that supports communities and their schools.

So where does parental choice fit into this model of support? More importantly, where does a selective secondary school system fit into the thinking about the issued raised in today’s report?

Three cheers for books

Book fairs are fun. Today, was the Wolvercote Book Fair in north Oxford. A small local event, but I sold enough of my book to cover costs and have some enjoyable chats with other publishers, authors and booksellers. See does your library | Search Results | John Howson for details of my book of posts from this bog, available either from Amazon or direct from me by ordering through the comments section.

What struck me today, for the first time, while talking to authors, is that the current drop in the birth rate is going to make life harder for the book trade, and especially those selling into the markets for pre-readers and early readers. I guess that the big publishers will manage, but smaller publishers, and the growing market of self-publishers might notice fewer customers for their writing. However, I suspect that many authors in this market aren’t publishing to earn a living, but either as a side line or even, just because one can these days.

Between 2025 and 2030, the nursery and primary school population in England is expected to shrink by around 300,000, from 4.5 million to 4.3 million. When the latest estimates appear next month, this number may have grown even larger. Release home – National pupil projections – Explore education statistics – GOV.UK

Eventually, this downturn in pupil numbers will affect textbook sales and purchases by secondary school libraries, as the secondary school sector is also affected by falling student numbers. If, at the same time, school budgets come under pressure, and in order to support staffing costs, then anything related to pupil numbers, such as books and other resources, may well be high on the agenda for cuts in spending.

I wonder whether there is now a space for competition to Amazon as a publisher for the self-publishing market that is both easy to use and cost effective. Any scheme would need to cover both ebooks and physical books, and to allow for the downloading a copy at home by purchasers. This latter opportunity offsetting the postage and packing costs of a physical copy of a book with the cost of the paper and ink. Would it work, even if it is on paper and doesn’t look like a traditional book. Afterall, articles have been available on-line for years.

I have often wondered why schools, and especially MATs and local authorities, don’t do more to sell resources to each other. I know that some schools and colleges do so, but I wonder whether there is scope for more initiatives of this kind now that publishing is so easy. How about a publisher in residence, to sit alongside the artist and musicians in residence to encourage teachers and pupils to generate material for publication and use by others.

Finally, I was asked if I would produce a 100 best posts from the 13 years of the blog. Now there’s a though. No 1 most read post is the one about how much holiday do teachers really have? This was first published on May 30th 2002, and is still available to read.

No, No, No, please do not impose a GCSE test on university applicants

There was a discussion this morning on the BBC radio Today programme about a suggestion from Whitehall that everyone claiming a student loan should have a pass in English at GCSE. By English, I assume they mean English Language. I am vehemently opposed to such an idea. Let me explain why.

In the 1960s, when I was in the third year of my sixth form career, with ‘A’ Level grades of BBC in History, Geography and Economics, and a merit in what was then the special Paper, I still didn’t have a pass in English. (After six attempts, I finally succeeded in the following January examination).

Looking to universities where I could apply to study, some of whom had only recently dropped Latin as a compulsory requirement for many subjects, I struggled to find six courses that I could apply for without a pass in English Language.

In the end, LSE, a university with large number of mature students with non-standard entry requirements, Leicester, and a couple of then new universities were my only options. Eventually, I joined my twin brother to study at LSE, following in our father’s footstep, although he studied as a part-time mature student, and I was a full-time day student with both a grant and a scholarship.

So, I oppose any move to ration university places by such an arbitrary measure as a pass in GCSE English, just as I oppose the idea of a sudden death all or nothing Baccalaureate – even the IB, with its many good points.

However, I don’t just rest my opposition on the basis of my personal testimony.  As previous posts on this blog have demonstrated, the education offered to pupils that put their trust in the State to educate them varies significantly from place to place, and over time.

After a period of teacher shortages, lasting more than a decade, the nation may now be moving towards a period when becoming a teacher becomes more difficult and everyone can be taught by teachers qualified in their subject.

But, should those teaching music, art, parts of design, and other subjects be restricted by a requirement to be proficient in English before taking a degree course?

Well, of course, they already are if they want to be a teacher, as ITT has minimum standards. When undergraduate teaching degrees were still commonplace, universities used to set approved tests for those without the paper qualifications in English. I guess such local tests would be a way around any new requirement. However, if the government mandated that access to student loans required either a pass in English or any other such approach, individual institutions might find circumventing the new rule more of a challenge.

The figure of 33,000 students without a pass in English was mentioned in the radio piece. However, we weren’t told what subjects they were studying. There may well be a debate about the numbers going to university, but as a society I would hope that we had moved beyond such an arbitrary rule: then I look at requirements for entry into school sixth forms, and know that today, I would not even have made it to ‘A’ Level, and those grades I acquired, in far too many schools.

We may need more cash for defence, but not at the expense of the education of late developers, those brought up in the wrong geographical area, and those facing the many other barriers already in place for our young people considering higher education and a degree.

It’s the numbers not the percentages that matter most

Each year, the DfE publishes details about the workforce in schools. The data about teacher numbers are collected in the School Workforce Survey, conducted every November.

Included in the data are details about teacher retention in state funded schools. Interestingly, although the DfE provided the actual number of NQTs each year, the retention data is shown as a percentage of that base number. Release home – School workforce in England – Explore education statistics – GOV.UK as demonstrated in the following table.

The picture is obvious, despite some late arrivals after qualifying, the percentage falls for each extra year of service, so that of the 2010 cohort, only 59.2% were still in service after 10 years.

 Over the past few years, the percentage in service after one year has fluctuated from a low of 85.1 for the 2016 cohort to a high of 89.9 for 2023 cohort, with the 2024 cohort still doing well, with a retention rate of 89.7% at year 2. This looks like good news for the government.

However, there is less good news for the cohort that joined during covid in 2020 and 2012. For these two cohorts, retention after four and five years is poor, and back to levels last seen in 2014 for the 2021 cohort.

So, good news, retention is improving. Might the government even meet its target of of 6,500 extra teachers? Now it is time to change the percentages into numbers.

Here the picture is different. I have projected an extra year for the 2024 cohort and two years for the 2023 cohort just to show what might happen. The behaviour of those two cohorts is very important as they represent the lowest intakes of NQTs since 2010. Sadly, the government doesn’t publish the table by sectors. This is important because it is the key secondary subjects that already start with shortages where retention really matters for the performance of the school system, and especially for the outcomes for children in schools with high percentages of pupils on Free School Meals.

The current ten-year loss numbers show a worrying trend.

Hopefully, this loss of experienced teachers will reduce over the next few years, as the cohorts following the 2015 cohort have better retention numbers and percentages. The real concern is the 2020 and 2021 cohorts.

However, with falling rolls, starting to appear in the secondary sector, and already seriously affecting the primary sector in London, the retention rates for teachers may well improve, if schools can continue to afford the same number of teachers.

As my previous posts have made clear, the relationship between the National Funding Formula and pupil numbers will be crucial to future size of the teaching force. Falling Rolls: Is the funding formula making matters worse? | John Howson

Are there now two classes of NEETS: traditional and Modern?

Most of the comments about yesterday’s report on NEETs (not in Education, Employment or Training) Young people and work: interim report – GOV.UK by Alan Milburn,  focused on the outcomes, especially the rising percentage of NEETs in the population. Fewer commentators delved deeper into the report to look at some of root causes that are likely to increase the chances off someone becoming a NEET.

I think there are now two groups of NEETs. The long-standing group, discussed below, and a newer second group of university graduates, unemployed or underemployed by age 25. This second group requires different approaches to the first group, but could be disproportionally affected by the increasing importance of AI in the labour market, and especially the loss of entry level jobs that is akin to the loss of manual labour jobs over the past half century. I will reflect upon this issue in another post.

For the first group, the following extracts from yesterday’s Report once again tell us everything we need to know: fail early, fail often.

4.2 Early years: where the trajectory begins

302. The system knows, from the moment a child arrives at school, who is most likely to fail. It has the data, and the unambiguous evidence. A study of over 8,000 young people in Bradford found that children who were not school-ready at ages 4 to 5 were nearly three times as likely to be NEET at ages 16 to 17 years old. 11% of those who did not reach a Good Level of Development at reception were later NEET, compared with just 4% of those who did.[footnote 273] Research tracking children from school entry through to their late teens shows that most of this effect operates through academic attainment.[footnote 274] A child who falls behind at 5 years old is on average still behind at 16 years old. Missing early building blocks propagates forward through every key stage. Around 65% of the relationship between school readiness and later NEET status runs through this academic pathway.[footnote 275]

4.3 Schooling

The attainment gradient

309. Taken on its own terms, much of the schools system looks relatively strong. In England, those aged 15 perform above the OECD average in reading, maths and science.[footnote 287] Level 2 attainment in English and maths by age 19 reached 76.1% in 2023 to 2024, the second highest on record,[footnote 288] although it has fallen back slightly to 73.2% in 2024 to 2025.[footnote 289] Those aged 16 to 19 score above the OECD average in literacy and adaptive problem solving, with significant improvements in literacy and numeracy since 2012.[footnote 290] Only around 5% of non-disadvantaged young people fail to enter a sustained destination after Key Stage 4.[footnote 291]

310. And yet the relationship between social background and educational attainment in England is unbroken. It has survived every reform of the past three decades. Disadvantaged children still perform substantially worse at every stage of education. The gap does not close as children move through the system. It widens.

311. At age 7, the most disadvantaged pupils are 16 percentiles behind their most advantaged peers. By age 18 or 19, the same young people are 29 percentiles behind.[footnote 292] 12 years of schooling, and the gap has nearly doubled.

312. The damage begins early and locks in at primary school. At Key Stage 2, just 47% of disadvantaged pupils reached the expected standard in reading, writing and maths, compared with 69% of their peers, a 22 percentage point gap.[footnote 293]

313. Primary schools do not receive the same level of attention in the public debate on education as secondary schools.  Perhaps that is why the ambitions that have been set for primary school children are surprisingly low.  On the face of it, it is astonishing for example that successive governments have set targets for primary schools to only have 75% of their pupils leaving with the age-appropriate level of numeracy and literacy skills.  In other words, the State assumes that one in four will never achieve that standard.

As I wrote about an earlier Social Mobility Commission Report, Education counts, but so does the family | John Howson

[This report] “raises a number of interesting questions. Most are not new, but they are none the worse for restating.

Life changes, at least as far as incomes are concerned, seem to be a combination of education, local labour markets, soft skills and parental ability to offer support for life chances.” John Howson Blog 15th September 2020

We have also known for a long time the importance of ‘soft skills. Here is an extract from my blog written after an earlier Social Mobility Commission Report

In 2009, I concluded that ‘the activities relating to having fun and socialising are the key activities of out-of-school activities.’ The Social Mobility Commission chairman has concluded that

“It is shocking that so many children from poorer backgrounds never get the chance to join a football team, learn to dance or play music. The activity either costs too much, isn’t available or children just feel they won’t fit in. As a result, they miss out on important benefits – a sense of belonging, increased confidence and social skills which are invaluable to employers. It is high time to level the playing field.”  Blog July 19th 2019 The importance of soft skills and those that miss out | John Howson

Even earlier, after a Social Mobility Commission of 2017, I commented that

“Of most concern in the report is the fact that there is still general acceptance that educational opportunity is still shaped by background, with those from poor backgrounds having least opportunities and that the level of opportunity deteriorates between school and university.” June 15th 2017  Class rules: not OK | John Howson

Go even further back to 2014, and an early post on this blog commented about social mobility that

“The Commission also discuss parental involvement and the poor quality of career advice that is often linked to low expectations. More must be done to encourage parents that the education system failed not to let the same thing happen with the next generation. Breaking the cycle of hopelessness is a vital component to raising standards as the Commission acknowledges. How to disseminate best practice rather than ritual nods to devolving training to schools and Teach First might have allowed for discussion about the content of both initial training and professional development of teachers.

Where I do agree with the Commission is in the vital role played by primary schools and the need to focus more attention on success in the early years. Regular attendance and strategies to help pupils that miss school are important moves in helping all pupils achieve success as last week’s publication of the EYFS profiles showed.

For anyone interested in the issue of social mobility this is an important but at times challenging and even depressing Report to read. It can be found at” https://www.gov.uk/government/uploads/system/uploads/attachment_data/file/364979/State_of_the_Nation_Final.pdf

 Blog post 21st October 2014.

So, way back in 2014, much the same comments were being made as in Section 4.2 of the current report, quoted at the start of this post.

We have a lost generation after what happened to those in early years after 2014, including and the slaughter of the Children’s Centres, the banishment of vocational skills from the curriculum, and a decade of teacher shortages leaving many disadvantaged pupils floundering at school in a system that was more interested in tacking organisation issues than creating a school system for all.

Sir John Newsom must be turning in his grave. Half Our Future: A tribute | John Howson