Are London schools overfunded?

Let me be clear the answer is, of course they are not. However, as my previous post showed, there were significant differences in exclusion and suspension rates in the latest DfE data between many London boroughs and other local authorities across England. Do better funded schools exclude fewer pupils? Part 2 | John Howson with London borough having some of the lowest levels of both exclusions and suspensions.

This discrepancy between London and the rest of England, prompted me to explore the data at a regional level on two different factors: ethnicity and Free School Meals. At some point, it might be interesting to combine these two factors, but for now, they are treated as separate factors. This post deals with pupils eligible for Free School Meals. I hope, in a later post, to consider the data about ethnicity, where the are significant differences between different ethnic groups.

Firstly, here is the table for outcomes for entitle pupils for Free School Meals across primary, secondary and special school sectors.

Free School Meal – entitled pupils 2024/25 All school sectors
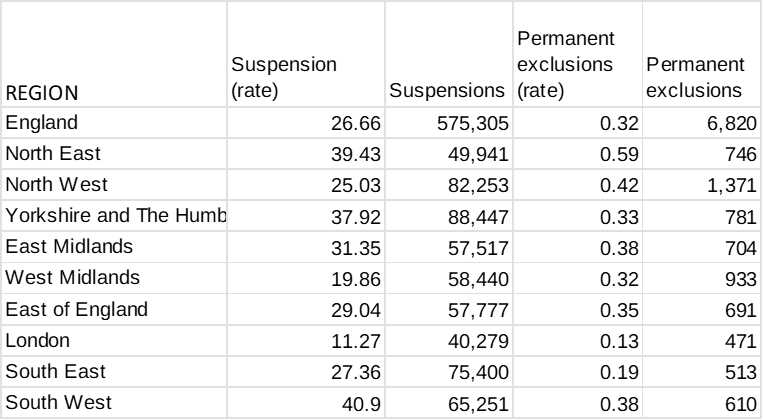
London stands out as the lowest rate for both exclusions and suspensions of any region in England. Permanent exclusions in the North East are more than four times higher than the rate in London, and even suspensions are more than four times higher than in the London region.

Of course, London schools may use other sanctions, such as in-school suspensions, but the differences do seem stark between the regions, with London schools using less than half the rate of suspensions of schools across any other region.    

In terms of pupils not entitled to Free School Meals, the differences between London and the rest of the regions are less stark.

Free School Meal – non-entitled pupils 2024/25 All school sectors

However, London still has a ‘suspension rate’ of less than half of that in the three regions with the highest rate of suspensions. Permanent exclusion rates for pupils not eligible for Free School Meals are generally very low across England, but, even so, London, along with the South East still had the lowest rate of permanent exclusions in 2024/25.

Free School Meal – non-entitled pupils 2024/25 Primary school sector
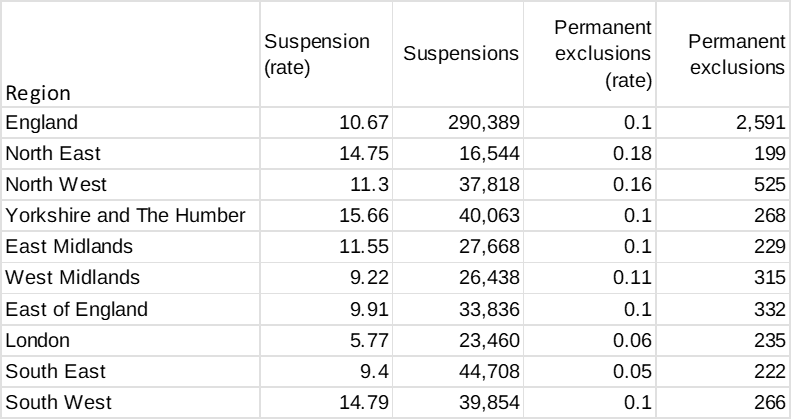
London doesn’t quite have the lowest permanent exclusions in the primary sector for pupils not entitled to Free School Meals: the rate in the south East is 0.01 better than in London. However, London does have the lowest rate for suspensions.

Free School Meal – entitled pupils 2024/25 Secondary school sector

Even with secondary school pupils entitled to Free School Meals, London has both the lowest rate of suspensions and of permanent exclusions o any region in England. Again, whether this is as a result other in-school measures, better staffing because of funding, or some other reasons isn’t discernible for the data.  

However, it will be interesting to consider the data for ‘ethnicity’ where London is one of the more diverse regions of England. This is because some London boroughs have low percentages of pupils on Free School Meals.

Does the funding of schools on a model of average salary funding model, with an additional London weighting in the National Funding Formula play any part in this data? For instance, does London employ more new teachers at below average salary rates.

Going forward, how will falling rolls affect the finances of schools in London and, hence, the possible rate of suspensions and exclusions in future years?
Do better funded schools exclude fewer pupils? Part 2

Earlier this week the DfE published the 2024-25 school-year data about temporary suspensions and permanent exclusions by schools. Release home – Suspensions and permanent exclusions in England – Explore education statistics – GOV.UK

The good news is contained in the headlines:

The rate of suspensions in the 2024/25 academic year was 10.88 (equivalent to 1,088 suspensions for every 10,000 pupils). This is a decrease from 11.31 in 2023/24. There were 913,000 suspensions in 2024/25, a decrease of 4% from 955,000 in 2023/24.

The rate and number of permanent exclusions also decreased from 2023/24 to 2024/25

The rate of permanent exclusions in the 2024/25 academic year was 0.12 (equivalent to 12 permanent exclusions for every 10,000 pupils). This is a decrease from 0.13 in 2023/24. There were 9,900 permanent exclusions in 2024/25, a decrease of 9% from 10,900 in 2023/24.

As the data are per 10,000 pupils, the outcomes are not affected by falling pupil rolls. However, since falling pupil numbers have yet really impacted on the secondary school sector, where most pupils are excluded or suspended, I wouldn’t have expected falling rolls to have had an impact in 2024-25.

A more interesting questions is whether funding for schools plays any part in the ability of schools to retain pupils rather than suspend or exclude them. Answering this question is slightly more complex than it might be because not all schools may behave in the same manner. for instance, Oxfordshire, a county I know well, has a higher rate of temporary suspensions, where it ranked 83 worst out of 154 local authorities in the 2024-25 data, compared with a ranking of 11th best of the 154 authorities for permanent exclusions.

However, as I have shown before, London schools are well funded compared with schools outside the capital. Thus, without a deliberate local policy to try to reduce either exclusion and suspensions, or indeed both, by schools outside the capital, it might be expected that London local authorities might rank as authorities with the lowest percentages of exclusions and suspensions.

The data for the rankings of London authorities in both 2023-24 and 2024-25 are shown in the table.

NUMBER OF LONDON BOROUGHS IN THE TOP 35 RANKED LOCAL AUTHORITIES
SCHOOL YEAR PERM EXCLUSIONS TEMP SUSPENSIONS
202324 19 27
202425 16 28

The figures for both years are impressive, with 28 of the London boroughs in the top 35 local authorities for the lowest temporary suspension per 10,000 pupils. However, this is not a new trend. In a previous post last year, I wrote the following:

As ever, I am struck by the funding issue. London, the best funded part of England has some of the lowest rates for exclusion and suspensions. There are 17 London boroughs in the list of the 25 local authorities with the lowest rate of suspensions in 2023/24, and 19 in the similar list for secondary exclusions. In the list of ten local authorities with the highest rates of exclusion are five authorities in the North East. I think that there may be something in this data that needs further exploration, especially as I would expect teacher recruitment to be easier in the North East than in London. Do better funded schools exclude fewer pupils? | John Howson

Once again, in the latest data, local authorities  in the north East fare badly, with five in the ten lowest rankings for permanent exclusions, and six in the ten lowest rankings for temporary suspensions.

Many London schools also have the benefit of Teach First in addition to their DfE funding. Even though they have to pay towards the Teach First trainees, the extra support is possibly another reason why London schools perform so well on this measure.

I wonder whether this issue is a concern to our incoming Prime Minister in view of the rankings for some local authorities in the north West of England.

Is Labour wrecking London’s Schools?

This blog has revealed in a previous post how in many London borough the fall in pupil numbers in the primary sector has resulted in a worsening of the pupil teacher ratios (PTRs) in many boroughs. Worsening PTRs will most likely mean larger classes or greater use of unqualified staff to ‘teach’ children. Falling rolls in London: much worse than the rest of England | John Howson

A closer examination of the data reveals that the boroughs with greater issues of deprivation seem more seriously affected by the worsening PTRs. However, boroughs are frequently not homogenous in nature. Haringey has affluent Highgate in the same borough as Bruce Grove and Wood Green.

As a result, it is worth looking at the data from the lens of a smaller unit such as the parliamentary constituencies, although it has to be acknowledged that many of those are also not homogenous:  Edmonton & Winchmore Hill and Southgate and Wood Green both spring to mind as two constituencies with very different localities within them. However, constituencies are better than boroughs and larger than council wards – too small for this exercise.

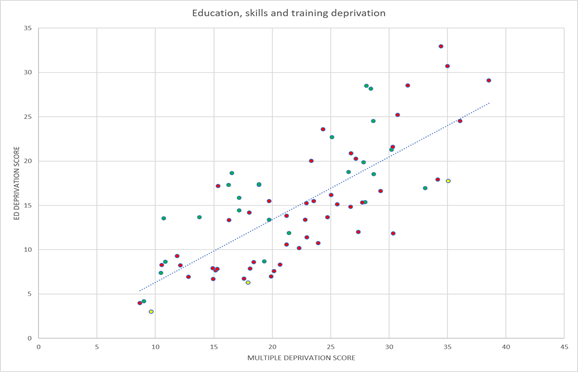
The following chart plots the index of multiple deprivation score for each current London parliamentary constituency against the index of education, skills and training deprivation taken from the work undertaken by the House of Commons library  Deprivation in English constituencies, 2025 – House of Commons Library

The red dots on the plot are constituencies where the PTR in the constituency, as measured by the DfE, has worsened between 2022/23 and 2025/26. The green dots show constituencies where the PTRs has improved, and the yellow dots are where the PTR was the same in the most recent year as it was in 2022/23.

As expected, there is a strong correlation between constituencies with a high score for multiple deprivation and their score on the education, skills and training deprivation index. However, many constituencies with high deprivation scores have also seen their PTRs worsen – red dots on the chart.

Of course, London primary PTRS are still some of the most favourable in the country, but just not as good as they were a few years ago. The question therefore arises as to whether worsening PTRs will lead to a deterioration in outcomes from the levels achieved in the quarter century since the introduction of the London Challenge and all that went with it.

It is also worth noting that the data was based upon the ratio of qualified teachers to pupils. Many London schools have unqualified teachers, employed through programmes such as Teach First and the apprenticeship scheme. However, both schemes are more common in the secondary sector than in primary schools.

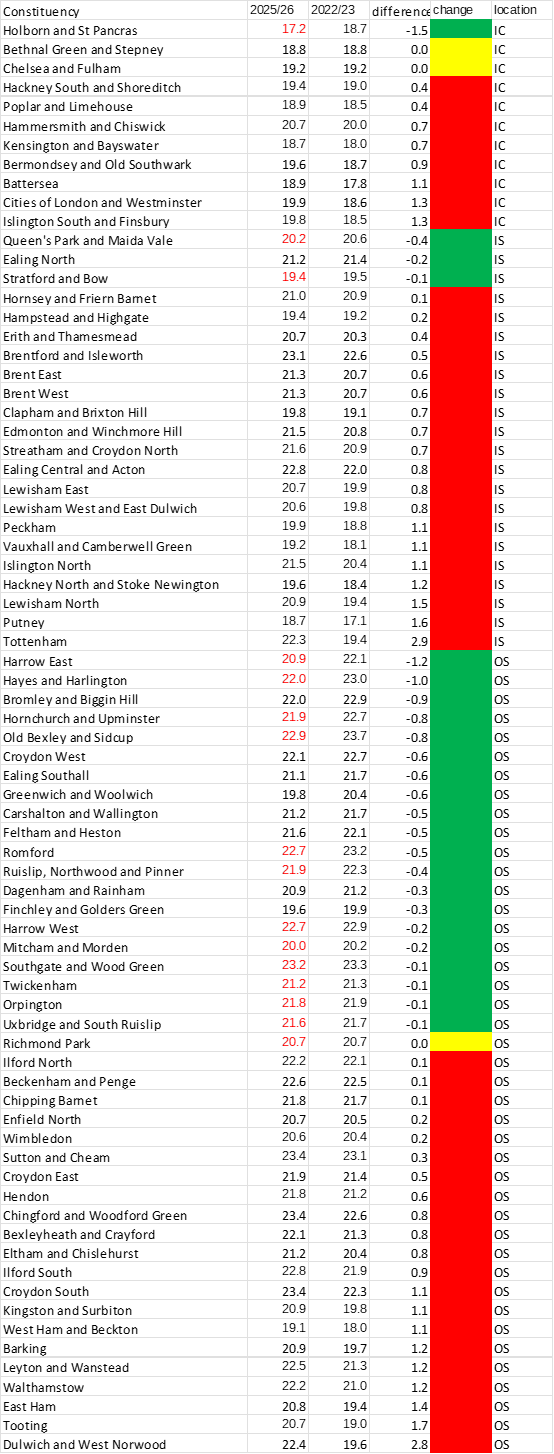
The following table lists the changes in primary PTR by constituency and adds my view of whether each constituency is an:

Inner-City        IC

Inner Suburb  IS

Outer suburb OS

Constituency. This is a subjective judgement on my part, but it does reveal that from the list that Holborn & St Pancreas appears to be the only inner-city constituency with an improved PTR over the period. Why that should be is an interesting question that cannot be answered from the data alone.

Falling Rolls: Is the funding formula making matters worse?

There has been a lot of discussion recently about falling school rolls in the primary school sector in London. This discussion led me to wonder whether a funding formula that is heavily weighted to a per pupil funding model might mean schools with falling rolls would have to adapt to a decrease in their income.

One possible outcome of less funding could be a worsening of pupil teacher ratios if individual support for pupils with SEND is cut, and also whole classes are amalgamated. My thesis is that Inner London boroughs might be witnessing the worst of the falling rolls problem, partly because they are boroughs with little room for new housing to be built, but also because inner cities have traditionally been the home of new arrivals to a country. Post Brexit, many European families from countries such as Poland and Romania may also have chosen to return home, taking their children with them.

With the release last week of the school workforce data for 2025/26, by the DfE, it is possible to review the pupil teacher ratios (PTRs) for each borough for the three-year period from 2023/24 to 2025/26.

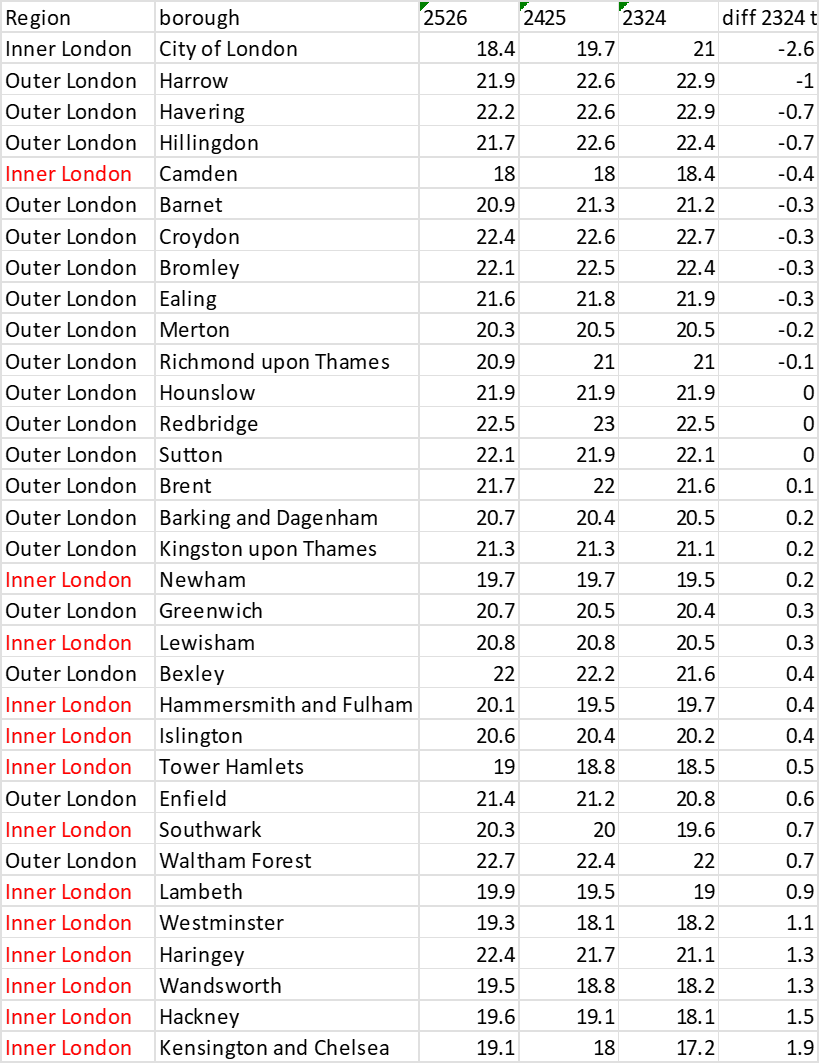
Of the boroughs in London, including the City of London, 11 boroughs improved their primary PTRs between 2023/24 and 2025/26. All but one, Camden, were Outer London boroughs. All the other Inner London boroughs recorded a worsening of their primary PTRS over the three- year period.

In the case of Kensington and Chelesea, albeit a small borough, the change was from 17.2 to 19.1 pupils per teacher over the three years: a decline of some 10%. This is a relatively large change for such a short period of time.

Seven Outer London boroughs also recorded a worsening of their primary PTRs over the same period. Of these boroughs, two, Newham and Greenwich have been classified as Inner London boroughs at sometime in the past.

Apart from the City of London, the boroughs with most improved PTRs are on the edge of London – Harrow, Havering, Hillingdon, Barnet, Croydon and Bromley.

The data in the table does suggest that falling rolls have been accompanied by a worsening of PTRs. Might this be caused in part by the construction of the National Funding formula that is heavily weighted towards a per pupil element? Reduced funding is certainly likely to impact upon class sizes and the use of teachers with small groups. Increasing class sizes and cutting individual teacher support for vulnerable learners is likely to impact upon a school’s PTR. If the reduction in pupil number sis widespread across a borough, then the impact will be seen in the PTRS for all primary schools in the borough.

I think that there is a case to be made that falling rolls are worsening PTRs for the remaining pupils across much of Inner London.

For a longer-term analysis of PTRS in London, and how over time they have been better than in most of England see  (1) (PDF) PTRS OVER TIME: A REVIEW OF PUPIL TEACHER RATIOS BETWEEN 1974 AND 2024 AND TWO PERIODS OF LOCAL GOVERNMENT RE-ORGANISATION PTRS OVER TIME: A REVIEW OF PUPIL TEACHER RATIOS

Children missing from schooling

This is going to be one of my ‘nerdier’ posts. Children missing education are a small but important group of young people. In the autumn term of 2025/26, the DfE estimated that there were around 34,700 such pupils in England – down for 39,200 in the previous autumn term of 2024/25. Across the whole year 2024/25, some 143,000 children were estimated by the DfE as missing education at some point in the year. Children missing education: methodology – Explore education statistics – GOV.UK

The DfE relies upon local authorities for the collection of the data. The re-organisation of the shire counties over the next few years may well affect data quality, where new ‘unitary authorities’ are created and new teams will need to be assembled. So, how are ‘missing children’ defined?

Definition of children missing education

CME does include children of compulsory school age who are not registered at a school and are not receiving suitable education elsewhere, even if these children:

• Are in the process of applying for a school place, even children within the first 15 days of the application process

• Have been offered a school place for a future date but have not yet started

• Are receiving EHE, if this education is unsuitable

• Have been recorded as CME for an extended period: for example, where their whereabouts is unclear or unknown4 When EHE should be deemed CME An EHE child whose education is deemed unsuitable should no longer be classified as an EHE child and should be classified as CME.

Section 436A of the Education Act 1996, is a duty on local authorities to make arrangements to try and identify children of compulsory school age who are not registered pupils at schools and are not receiving suitable education otherwise than at a school. Although there is no legal obligation on local authorities to classify a child as CME at a particular stage of the statutory process under sections 436A and 437 of the Act, we would expect a local authority classify a child as CME once they have deemed that the child is not receiving suitable education (which would include having insufficient information to reach such a conclusion). If local authorities have not had an opportunity to assess whether a child is receiving suitable education, that does not mean that the child should automatically be classified as not receiving suitable education. Not knowing does not mean the child is not being suitably educated, though the local authority may ultimately reach this conclusion if they have asked for information and not received satisfactory responses. Elective Home Education and Children Missing Education

How assiduous are local authorities at collecting this information? Difficult to say, but it is interesting that 11 of the 33 London boroughs have a rate of 0.1%, the best possible. This is along with six local authorities in the North East, and five counties. However, no local authority in the East of England features in those LAs with a 0.1% return, the best being 0.3 and the worst 1.0%.

Overall, the average autumn term rate fell from 0.5% in 2023/24 – the first year of collection to 0.4% in 2025/26.

Why does the issue of children missing education concern me. My posts on Jacob’s Law shows why I thinking understanding the problem is important Time for Jacob’s Law | John Howson

My suggestion last summer was for a virtual school for all such children otherwise classified as missing education A Virtual School for those missing school? | John Howson This could be especially important for young people with SEND awaiting a school place as well as those that move into an area mid-year when all school places in their year group are full.

I would encourage local politicians to check their percentage of missing children, and how well officers track such children. It was an Ombudsman’s report that originally sparked my interest in this issue.  Education is a fundamental Human Right | John Howson

The original paper to Oxfordshire’s Scrutiny Committee in 2019 highlighted 9,600 records that were incomplete at that time and the exercise Oxfordshire officers took to update their records!  aebhdfh I wonder how many local authorities have conducted such a thorough examination of their records.

Hopefully, now the DfE is collecting data, more attention is being paid to children that might slip though the net.

KS2: The London effect?

Earlier this year, I produced a report looking at the changes in pupil teacher ratios over the past fifty years as between London boroughs and the rest of England’s local authorities that have remained on the same boundaries since 1974. London boroughs generally have had some of the ‘best’ PTRs throughout the past 50 years. As a result, it was no surprise to see how well schools in the London boroughs performed in the KS2 results for 2025, published by the DfE yesterday.

It is interesting to look at just one measure, the percentage of pupils achieving the higher standard in Reading, and the percentage change in this measure over the past decade or so.

2015/162024/25
higherhigherdifference
LAReadingReading
Waltham Forest15%44%29%
Redbridge19%45%26%
Westminster18%43%25%
Haringey20%43%23%
Newham18%41%23%
Hammersmith and Fulham24%46%22%
Luton11%33%22%
Merton22%44%22%
Barking and Dagenham15%37%22%
Enfield15%37%22%
Sutton25%47%22%
Hackney21%42%21%
Brent16%37%21%
Barnet24%44%20%
Bexley20%40%20%
Lewisham19%39%20%
Southwark19%39%20%
Slough19%39%20%
Tower Hamlets18%38%20%
Birmingham14%34%20%
Leicester11%31%20%
Trafford27%47%20%
Solihull20%39%19%
Hillingdon19%38%19%
Ealing18%37%19%
Wolverhampton14%33%19%
Barnsley13%32%19%
Thurrock13%32%19%
Doncaster11%30%19%
Camden23%42%19%
Greenwich22%41%19%
Croydon17%36%19%
Richmond upon Thames36%54%18%
Kingston upon Hull, City of15%33%18%
Kensington and Chelsea30%48%18%
Blackburn with Darwen13%31%18%
Walsall13%31%18%
Knowsley12%30%18%
North East Lincolnshire11%29%18%
Lambeth23%40%17%
Stockport22%39%17%
Warrington21%38%17%
Stockton-on-Tees16%33%17%
Bromley27%44%17%
Wandsworth25%42%17%
Harrow24%41%17%
Milton Keynes19%36%17%
Sandwell13%30%17%

Leaving aside the City of London, with its one primary school that has been excluded form the dataset, 28 of the London boroughs appear in the table. This compares with 20 local authorities outside of London. None of the latter are ‘shire’ counties. Not even the Home Counties of Surrey or Hertfordshire make it into the list.

Looking at the other end of the table, there is a preponderance of counties authorities in the list

Tameside15%28%13%
Southend-on-Sea20%33%13%
South Gloucestershire20%33%13%
Telford and Wrekin19%32%13%
St. Helens18%31%13%
Rochdale14%27%13%
Portsmouth14%27%13%
Blackpool13%26%13%
Oldham13%26%13%
Rutland23%36%13%
Cheshire East22%35%13%
Cambridgeshire22%35%13%
Lancashire17%30%13%
Bedford16%29%13%
Cheshire West and Chester22%34%12%
Havering22%34%12%
Herefordshire, County of21%33%12%
Nottingham15%27%12%
Gateshead20%32%12%
Cornwall20%32%12%
Torbay20%32%12%
East Sussex19%31%12%
South Tyneside18%30%12%
Derbyshire18%30%12%
Suffolk18%30%12%
Swindon18%30%12%
Derby14%26%12%
Warwickshire23%35%12%
Oxfordshire23%35%12%
Gloucestershire23%35%12%
Southampton17%29%12%
Hampshire23%34%11%
Devon23%34%11%
Bristol, City of22%33%11%
North Somerset22%33%11%
Lincolnshire17%28%11%
Central Bedfordshire17%28%11%
County Durham20%31%11%
Calderdale20%31%11%
Shropshire20%31%11%
Sefton18%29%11%
Norfolk18%29%11%
East Riding of Yorkshire18%28%10%
Wiltshire23%33%10%
Darlington22%32%10%
West Berkshire25%34%9%
Bath and North East Somerset27%36%9%
Brighton and Hove26%35%9%
Northumberland21%29%8%
Isle of Wight16%23%7%

Even among the unitary authorities in the list, some, such as the East riding of Yorkshire and West Berkshire might be considered predominantly rural in nature.

So, what might be deduced from this data? Parental help does make a difference. Has the ‘gentrification’ of Walthamstow help propel it to the top of the table? To consider the issue of parental support versus government funding for schools it is worth considering the present percentage of achievement at this higher grade by schools in two parliamentary constituencies that I am familiar with; Tottenham, where I started my teaching career, and Oxford East, part of the city where I have lived and worked for the past 45 years.

SCHOOL Higher Grade RWM in KS” 2025TOTENHAMOXFORD EAST
A35
B27
C23
D1818
E1717
F15
G15
H15
I1414
J1313
K1313
L13
M12
N1111
O1010
P99
Q9
R8
S8
T77
U77
V77
W77
X6
Y6
Z55
AA5
AB5
AC44
AD44
AE33
AF3
AG23
AH2
AI2
AJ00
AK0
total322193
schools2827
average11.57.1

Both might be seen as constituencies with significant pockets of deprivation, but also areas subject to ‘gentrification’ in recent years. Schools in Oxford East have a profile with lower percentages than schools in Tottenham. How much of the difference can be ascribed to parents, and how much to better funding for London schools? Of course, class sizes also matter. But, as both are urban areas, the issue of small rural schools doesn’t really arise as it would if one compared Oxford East with its neighbouring constituency of Henley.

This work is at an early stage, but it does pose the question about the deep structure of school funding and, especially, the use of average salary data in any calculations in the funding of schools.

Is discipline worse in schools?

It was interesting to hear Laura McInerney and Tom Bennett on the ‘Today’ programme on BBC Radio 4 this morning discussing whether or not behaviour was worse in schools these days than in the past. Both are experienced commentators, and Tom led a review in 2017 for the then government, about behaviour in schools. It is also interesting to see the BBC taking an interest in schools. The World at One last Sunday (also BBC Radio 4) devoted the whole of the programme to an analysis of the SEND issue. Interestingly, there was no government spokesperson available on Sunday, so they had to make do with the chair of the Education Select Committee.

The discussion this morning was around whether or not behaviour had worsened in schools, and if so, why? The usual suspects, covid and mobile phones were trotted out in support of discipline being worse in schools, along with families facing multiple challenges, but there were precious few facts.

One way of measuring the state of discipline in schools is by looking at the number of permanent exclusions each year by schools.  The largest single reason each year for these exclusions is always ‘persistent disruptive behaviour’. So, this might be seen as a good proxy measure for how schools are faring in relation to discipline in the classrooms. Of course, this measure doesn’t pick up low level disruptive behaviour, but it is reasonable to assume that there is a correlation between the different levels of behaviour in schools.

Looking back over the past 30 years, the level of recorded permanent exclusions was 10,440 in 1998/99. The level fell to 5,040 in 2010/11. In the latest year, 2023/24 there were 10,885 permanent exclusions. On the face of it, discipline is getting worse again, but is only back to levels last seen at the end of the last century.

I would like to suggest to causes not mentioned on the ‘Today’ programme: teacher supply and school funding. Is there a causal relationship between the fact that permanent exclusions were at their lowest when schools were fully staffed, and had experienced a period of several years of significant funding by government.  By contract, permanent exclusions seem to rise when there is difficulty staffing schools, and when funding is less than might be expected in a civilised society.

So, is the answer as simple as proper funding and staffing if you want fewer exclusions? The age and experience of the teaching force might also play a part. More experienced teachers, as I can testify from personal experience, are much less likely to face discipline issues then new entrants, especially if they are unqualified.

In the latest statistics on exclusions, 13 of the 25 local authorities with the lowest rates of permanent exclusions were London boroughs. This just adds more evidence to my thesis that if the rest of the country were funded like London, schooling would be in a much better place across the country.  Although I was also pleased to see Oxfordshire in 10th place overall for the lowest rate of permanent exclusions.