London schools and challenging pupils: better outcomes than elsewhere?

Yesterday, I wrote a blog post about the rate of exclusions and suspensions from schools in London and the other regions of England of pupils eligible for Free School Meals as a part of a series about whether better funded schools were able to keep more of their pupils in schools. As promised in that post, I have also looked at the position with regard to the main ethnic, groups and a few of the less considered sub-grouping. Are London schools overfunded? | John Howson

As the following table shows, the picture for London is much more mixed with respect to the different ethnic groupings than for pupils eligible for Free School Meals.
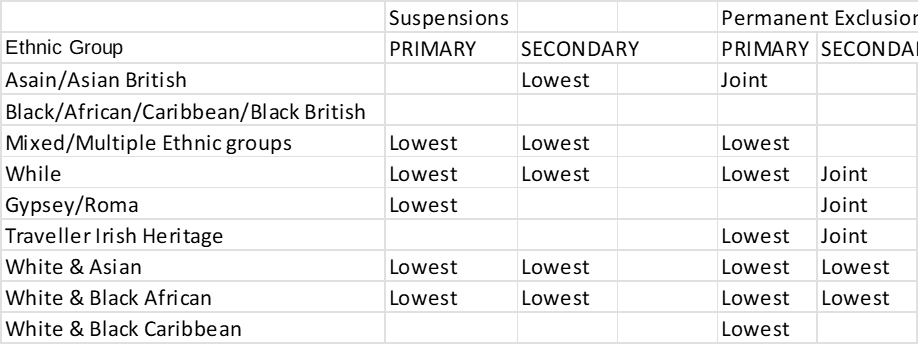
London had the lowest rate of suspensions for five ethnic groups in the primary school sector, and four in the secondary school sector.

In respect of permanent exclusions, where rates are generally very low, and a single exclusion can affect the rate significantly, London had the lowest rate in six of the nine ethnic groups for the primary school sector and was joint equal in a seventh group. In the secondary school sector, London had the lowest rate in only two categories, but was joint lowest in another three groups- mostly were there were no permanent exclusions in this group in a number of regions, including London.

The position in special schools was somewhat different, as shown in the table.
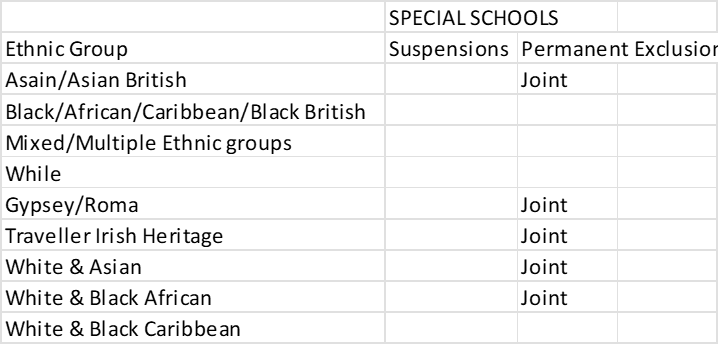
London was not the lowest region in any ethnic grouping in ‘suspensions’ in the special school sector, and was only joint lowest in ‘permanent exclusions’. In most cases there were no permanent exclusions in these groups in any of the regions listed as ‘joint’ lowest, including in the London region. As pupils may attend some special schools from different local authorities to that where they live, and the funding for such schools is not through the  ‘School Block’ but was through the discredited ‘High Needs Block’, it is difficult to read anything into the results for the special school sector, except to say that no other region has the same level of outcome as the London region.

London schools contain a much more ethnically diverse group of pupils than schools in some other of the English regions, notably the North East and South West regions. Despite this fact, or possible because the familiarity of dealing with pupils from a wide range of different ethnic groups, often in the same classroom, and sometimes having come to school in England from war-tern or other challenging environments, have meant policies are in place to deal with situations that were less common outside the capital’s schools, London as a region still outperformed any other region in terms of being in lowest place of any region either on its own or in joint lowest position.

One can wonder: is this due to the funding being better than elsewhere? The funding formula school prevent that outcome for primary and secondary schools, if not for special schools. However, as I asked in the previous post in this series, is it the fact that funding includes a London allowance important, as the extra cash may go further if London schools employ younger, and thus cheaper teachers than in some other parts of England.

Do London schools use their cash for more classroom assistants and other staff likely to help reduce the level of suspensions and exclusions?

The data is intriguing, and worthy of more analysis than I have time to undertake. Are there also lesson to be learnt from London schools about how to reduce the number of pupils ‘kicked out’ of schools?

Finally, do academies or maintained schools exclude or suspend more pupils in different groups of pupils? What role, if any, do local authorities still play in helping keep down the levels of suspensions and exclusions? Time for me to go search the research literature.

Are London schools overfunded?

Let me be clear the answer is, of course they are not. However, as my previous post showed, there were significant differences in exclusion and suspension rates in the latest DfE data between many London boroughs and other local authorities across England. Do better funded schools exclude fewer pupils? Part 2 | John Howson with London borough having some of the lowest levels of both exclusions and suspensions.

This discrepancy between London and the rest of England, prompted me to explore the data at a regional level on two different factors: ethnicity and Free School Meals. At some point, it might be interesting to combine these two factors, but for now, they are treated as separate factors. This post deals with pupils eligible for Free School Meals. I hope, in a later post, to consider the data about ethnicity, where the are significant differences between different ethnic groups.

Firstly, here is the table for outcomes for entitle pupils for Free School Meals across primary, secondary and special school sectors.

Free School Meal – entitled pupils 2024/25 All school sectors

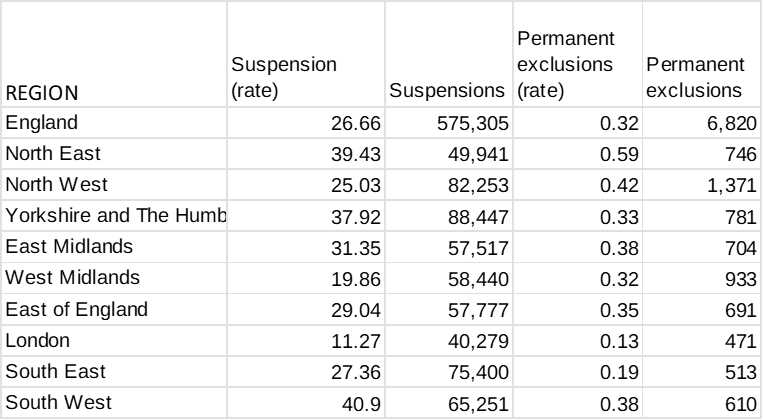
London stands out as the lowest rate for both exclusions and suspensions of any region in England. Permanent exclusions in the North East are more than four times higher than the rate in London, and even suspensions are more than four times higher than in the London region.

Of course, London schools may use other sanctions, such as in-school suspensions, but the differences do seem stark between the regions, with London schools using less than half the rate of suspensions of schools across any other region.    

In terms of pupils not entitled to Free School Meals, the differences between London and the rest of the regions are less stark.

Free School Meal – non-entitled pupils 2024/25 All school sectors

However, London still has a ‘suspension rate’ of less than half of that in the three regions with the highest rate of suspensions. Permanent exclusion rates for pupils not eligible for Free School Meals are generally very low across England, but, even so, London, along with the South East still had the lowest rate of permanent exclusions in 2024/25.

Free School Meal – non-entitled pupils 2024/25 Primary school sector

London doesn’t quite have the lowest permanent exclusions in the primary sector for pupils not entitled to Free School Meals: the rate in the south East is 0.01 better than in London. However, London does have the lowest rate for suspensions.

Free School Meal – entitled pupils 2024/25 Secondary school sector

Even with secondary school pupils entitled to Free School Meals, London has both the lowest rate of suspensions and of permanent exclusions o any region in England. Again, whether this is as a result other in-school measures, better staffing because of funding, or some other reasons isn’t discernible for the data.  

However, it will be interesting to consider the data for ‘ethnicity’ where London is one of the more diverse regions of England. This is because some London boroughs have low percentages of pupils on Free School Meals.

Does the funding of schools on a model of average salary funding model, with an additional London weighting in the National Funding Formula play any part in this data? For instance, does London employ more new teachers at below average salary rates.

Going forward, how will falling rolls affect the finances of schools in London and, hence, the possible rate of suspensions and exclusions in future years?

Do better funded schools exclude fewer pupils? Part 2

Earlier this week the DfE published the 2024-25 school-year data about temporary suspensions and permanent exclusions by schools. Release home – Suspensions and permanent exclusions in England – Explore education statistics – GOV.UK

The good news is contained in the headlines:

The rate of suspensions in the 2024/25 academic year was 10.88 (equivalent to 1,088 suspensions for every 10,000 pupils). This is a decrease from 11.31 in 2023/24. There were 913,000 suspensions in 2024/25, a decrease of 4% from 955,000 in 2023/24.

The rate and number of permanent exclusions also decreased from 2023/24 to 2024/25

The rate of permanent exclusions in the 2024/25 academic year was 0.12 (equivalent to 12 permanent exclusions for every 10,000 pupils). This is a decrease from 0.13 in 2023/24. There were 9,900 permanent exclusions in 2024/25, a decrease of 9% from 10,900 in 2023/24.

As the data are per 10,000 pupils, the outcomes are not affected by falling pupil rolls. However, since falling pupil numbers have yet really impacted on the secondary school sector, where most pupils are excluded or suspended, I wouldn’t have expected falling rolls to have had an impact in 2024-25.

A more interesting questions is whether funding for schools plays any part in the ability of schools to retain pupils rather than suspend or exclude them. Answering this question is slightly more complex than it might be because not all schools may behave in the same manner. for instance, Oxfordshire, a county I know well, has a higher rate of temporary suspensions, where it ranked 83 worst out of 154 local authorities in the 2024-25 data, compared with a ranking of 11th best of the 154 authorities for permanent exclusions.

However, as I have shown before, London schools are well funded compared with schools outside the capital. Thus, without a deliberate local policy to try to reduce either exclusion and suspensions, or indeed both, by schools outside the capital, it might be expected that London local authorities might rank as authorities with the lowest percentages of exclusions and suspensions.

The data for the rankings of London authorities in both 2023-24 and 2024-25 are shown in the table.

NUMBER OF LONDON BOROUGHS IN THE TOP 35 RANKED LOCAL AUTHORITIES
SCHOOL YEAR PERM EXCLUSIONS TEMP SUSPENSIONS
202324 19 27
202425 16 28

The figures for both years are impressive, with 28 of the London boroughs in the top 35 local authorities for the lowest temporary suspension per 10,000 pupils. However, this is not a new trend. In a previous post last year, I wrote the following:

As ever, I am struck by the funding issue. London, the best funded part of England has some of the lowest rates for exclusion and suspensions. There are 17 London boroughs in the list of the 25 local authorities with the lowest rate of suspensions in 2023/24, and 19 in the similar list for secondary exclusions. In the list of ten local authorities with the highest rates of exclusion are five authorities in the North East. I think that there may be something in this data that needs further exploration, especially as I would expect teacher recruitment to be easier in the North East than in London. Do better funded schools exclude fewer pupils? | John Howson

Once again, in the latest data, local authorities  in the north East fare badly, with five in the ten lowest rankings for permanent exclusions, and six in the ten lowest rankings for temporary suspensions.

Many London schools also have the benefit of Teach First in addition to their DfE funding. Even though they have to pay towards the Teach First trainees, the extra support is possibly another reason why London schools perform so well on this measure.

I wonder whether this issue is a concern to our incoming Prime Minister in view of the rankings for some local authorities in the north West of England.

Discipline in schools – the latest data around suspensions and exclusions in one area

Now that the local elections are out of the way, it is time to consider other issues – However, I might blog about my thoughts about schooling when all the results have been published and considered.

Earlier this week the DfE published data for exclusion and suspensions by schools for the spring term 202425; i.e. last year. The data came along with time series data for spring terms back to before the covid pandemic, indeed, starting in 2016-2017 school-year; the spring of 2017. Create your own tables on suspensions and permanent exclusions in england – Explore education statistics – GOV.UK

It is worth recalling that during the period under review by the DfE school rolls across the secondary sector have been on the increase, mostly as a result of the earlier rise in the birthrate. Some areas, including the one under consideration have also experienced a significant housebuilding boom for most of the period under review. New housing usually means more pupils.

I looked at the data for both suspensions and exclusions for all the secondary schools in one current local authority area. All but one school are currently academies, and most have been for the whole of the time period. Some schools have changed academy trusts during the time period, and three new schools have opened during the period, and one 14-18 school has closed.

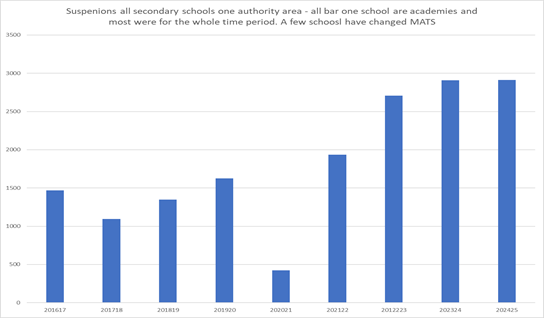
The schools already had noticeable numbers of suspensions before the covid pandemic. Since then, the numbers each year have been much higher, than before the pandemic, as shown in the chart.

The last three years for which data are available witness record numbers of suspensions, although not all schools have increased suspensions at the same rate. The range in the spring term 202425 was from one school with just 6 suspensions, to another with 291, albeit, this was one of the largest schools in the authority. However, it was not an urban school. Eight schools each recorded more than 100 suspensions in the spring term of 202425.

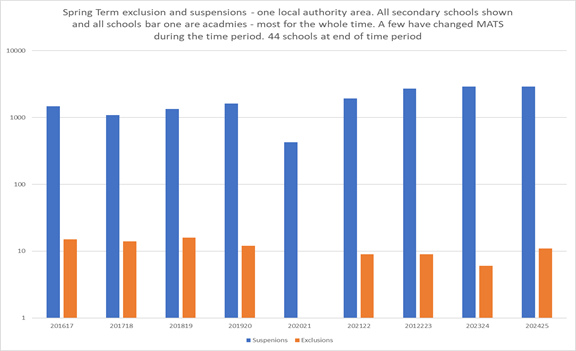
The picture for exclusions is much more encouraging, as can be seen on the following chart. This uses a logarithmic scale to plot both suspensions and exclusions. Exclusions across the authority have rarely exceeded ten in a spring term.

Of course, the total of suspensions for any one school can include multiple suspensions for the same pupil. The length of the spring term can also be affected by the changing date of Easter each year. This factor might have a small effect on each year’s data.

Of course, some pupils may not be ‘excluded’ at all, and hence not feature in these charts, but may be voluntarily removed to ‘home schooling’ by their parents. Whatever happens to pupils suspended or excluded, not being in school is more likely to see them become involved in a life of crime, often more serious crime than if they were in school on a regular basis.

Do some academy trusts have higher rates of suspension than other trusts among their schools? This is a challenging question to answer because it is clear that there is more likely to be a relationship between suspensions and the IDACI group in which the schools sits than the nature of the controlling MAT. However, it is clear than becoming an academy is not a panacea for solving the discipline issue of a school; at least as far as academies in this authority are concerned.  

Are suspension rates now on the way down? I hope so, but an not yet convinced that is the direction of travel. Time will tell.

Do children attend school?

The latest DfE repot of parent and student views contains some data that are at odds with the general perception of schooling. The data on attendance in the ‘voice’ results are so at odds with the general perception that it raises questions about who completes this sort of questionnaire. Parent, pupil and learner voice: May 2025 – GOV.UK

Generally, the perception is that fewer children are attending school on a regular basis. But here is the DfE’s evidence from their survey.

Across previous academic years, the proportions of pupils and learners who said they had been to school every day or most days were:

WaveKey stage 3 pupilsKey stage 4 pupils16-19 pupils and learners
2025-0596%95%84%
2025-0395%93%92%
2024-0997%96%
2024-0395%95%
2023-1296%94%

And for the parents the data are even more out of line with reality

Across previous academic years, the proportions of parents who said that their child had been to school every day or most days were:

WavePrimary parentsSecondary parentsSpecial parents
2025-0599%95%93%
2024-0998%96%91%
2024-0398%95%93%
2023-1299%95%91%

Would that 99% of primary pupils attended school that often. The reduction of only one per cent for the secondary sector parents between September 2024 and May 2025, from 96% to 95% even with sample sizes of more than 3,000 for both pupils and parents does seem a little out of line with the views coming from schools more generally about attendance.

Sickness or study leave were the two reasons given most frequently for absence by pupils and learners, followed by other reasons, where 16-19s had the highest percentage at 30%. Interestingly, 6% of the 16-19 cited the cost of travel, something this blog has highlighted as an issue.

Percentages for bullying s a reason for absence were low, at 5% of KS3, and 3% of KS4 pupils, compared with one per cent of KS3 parents, but 8% of KS4 parents: a big difference between pupil and parent responders.

Similarly, only 4% of KS3, and 3% of KS4 pupils, cited suspension or exclusion as reasons for missing school. Interestingly no parents of KS3 pupils, but 5% of KS4 pupils, cited suspension or exclusion as a reason for missing school.  

Tables 8 & 9 of the Technical Document on the Methodology contain the information about the percentage of parents and pupils that completed each wave, although no other information about their characteristics is forthcoming. This is despite the careful sampling frame developed to take account of a large number of different variables.  Parent, Pupil and Learner Voice Technical Report: September 2025

This does raise the question around who completes questionnaires and might the missing groups have had different responses? I cannot help but wonder whether the issue of response rates might have been more prominently discussed.  However, we all know persuading those sent questionnaires to return them is always a tricky task, so any responses are better than none.

Do better funded schools exclude fewer pupils?

The DfE published the annual data for exclusions and suspensions from schools during the 2023/24 school-year this week. Suspensions and permanent exclusions in England: 2023 to 2024 – GOV.UK Sadly, there are more pupils being excluded than in recent years, and my post from July 2018 Bad news on exclusions | John Howson reflects much , at least at the national level, of what is contained in the latest report on 2023/24. Boys on free school meals, and with SEND, and from a minority group are at highest risk of being excluded, especially when they are in Year 9, and, as ever, the reasons is most likely to have been ‘persistent disruptive behaviour’.

With the worsening recruitment crisis in schools, allied to a challenging financial environment, an increase in exclusions and suspensions was to be expected. What the data doesn’t tell us is whether schools with high exclusion rates are linked to specific academy trusts, and also to high levels of teacher turnover.

I wrote a blog about policies for reducing exclusions in May Reducing exclusions from schools | John Howson and I would hope that if the staffing situation does settle down, so might the number of pupils being banished from school.

As ever, I am struck by the funding issue. London, the best funded part of England has some of the lowest rates for exclusion and suspensions. There are 17 London boroughs in the list of the 25 local authorities with the lowest rate of suspensions in 2023/24, and 19 in the similar list for secondary exclusions. In the list of ten local authorities with the highest rates of exclusion are five authorities in the North East. I think that there may be something in this data that needs further exploration, especially as I would expect teacher recruitment to be easier in the North East than in London.

Interestingly, in view of the debate about mobile phones in schools, the number of suspensions for ‘inappropriate use of social media or online technology’ only increased from 11,419 to 11,614, an insignificant change between 2022/23 and 2023/24 especially compared with the increase in exclusions for ‘persistent disruptive behaviour’ from 446,676 to 569,921 over the same period. Of course, much comes down t how a decision on which box to tick when the exclusion is being reported and the latter category may hide suspensions that actually belong in one of the other categories. This is the risk when there are too many choices for a school to make.

The increase of around 25,000 in assaults leading to suspensions must be very worrying, although I wonder whether most are ‘common assault’ rather than ‘assault leading to actually bodily harm’ or ’GBH’ to use the criminal code levels of violence against another.

Some numbers are so small it is a wonder that they are still collected. Were only 69 pupils – up from 50 the previous year- permanently excluded for theft. Perhaps schools have nothing worth nicking these days.

I hope that next year, we might read of at least a levelling out of the rates of exclusions and suspensions and perhaps a return to a downward trend, especially if there is a relationship between funding and how schools can cope with disruptive pupils.  

Why do some schools suspend more pupils than other schools?

The levelling up debate seems to have somewhat been overshadowed recently by the concerns about Ofsted, and the issues with worker’s pay and conditions. However, the problem of how to increase success rates for some schools hasn’t disappeared.

As I have written before on this blog, the lack of any local ability to intervene in the absence of government funding stream for levelling up, means that improvements are often haphazard, if they even happen at all. Academy chains could shunt pupils out of their schools, and leave others to cope, and failing schools have limited support outside of opportunity Areas or other places with special funding.

For a long period of time, part of Oxford city – that city of dreaming spires – has been divided into two; the generally, affluenct and successful North and West of the city, and less well-off south and east, as the ONS data from the 2021 starkly reveals. Not so much a case of the wrong side of the tracks, but the wrong side of the river Cherwell – not, note, the river Thames.

As a result, it is perhaps not much of a surprise to find that two of the state-funded secondary schools within the city – both located in the south of the city – have places in the top 200 secondary schools by the rate of suspensions during the Spring term of 2021/22 school-year. Fortunately, neither is in the top 100 schools, and for both they are probably faring better than they were a few years ago.

This an issue that the government’s Social Mobility Commission Social Mobility Commission Quarterly Commentary: March 2023 – GOV.UK (www.gov.uk) might wish to explore in some detail.

Five of the 20 local authorities with the most schools in the top 200 secondary schools are authorities with selective secondary schools. One is a south coast unitary with a disproportionately large number of its non-selective schools in the list of the top 200 schools. Like Oxfordshire, it is an authority unlikely to attract extra funding for its schools under levelling-up, but there must be an issue to explore as to why so many of its schools are in this list?

A few years ago, University Technical Colleges used to feature strongly in this type of list, but closures and presumably some better understanding of transfer at fourteen has reduced their number to four, two of them being the only schools in their authority in the list.

The extent to which feeder primary schools for these 200 schools also feature in the list would be an interesting exercise to undertake. Also, it might be interesting to ask why one county has only one school in the list, whereas an adjacent unitary has three schools?

There is something of a north-south divide in the list and relatively few schools in London are in the list: an interesting turnaround from the last century, when I am sure that there would have been more of the capital’s secondary schools in the list. No doubt, the strength of some of the academy chains located in the capital has made a difference.