NEETs, schools and teachers

The DfE has recently published an analysis of the factors contributing to the risk of a young person becoming a NEET (Not in Education, Employment or Training) at certain ages. Risk factors for becoming NEET: a statistical analysis using linked data

The key conclusion was that

At each age group, and when controlling for overlapping risk factors, three factors stand out: persistent absence from school during KS4, having an EHCP, and not attaining 5 good GCSEs including English and maths.” Page 20

Two of these risk factors may have been made worse for some pupils by the fact that for the last decade there has been a shortage of qualified teachers in many subjects. Not all schools have suffered equally from staffing shortages, and within schools, not all pupils may have experienced the same degree of teaching from teachers with less than optimum qualifications and experience in the subjects that they were teaching in the secondary sector.

Might less than excellent teaching be a contributory factor to both absence during KS4, and the failure to attain 5 good GCSEs including English and maths? Perhaps the report would have benefitted from some cases studies linked to schools with high risks factors, but low rates of NEET?

Are there regional differences in the risk factors, perhaps associated with local job markets? Might the consequences of AI on the graduate labour market mean that such a study in a few years’ time might have a different set of risk factors?

Has education policy during the past decade, with an emphasis on the subjects in the English Baccalaureate contributed to some pupils becoming NEETs, perhaps because they found the curriculum, however well taught, not interesting at KS4, even though most will have accepted the need to study English and Mathematics.

In terms of in-school factors, I was surprised not to see anything about valued added from year 7 to 11. Can we trace the likelihood of becoming a NEET back to poor attendance in Reception at the start of formal education?

It seems to me that these are the questions we need to ask if policy decisions are to be made that will reduce the possibility of a young person becoming a NEET. By actions within schools.

However, the big challenge is the extent to which schools recognise the societal risk factors, such a being a young carer, having an ECP, moving school in KS4 and experience of being a Looked After Child.  Teachers are generally form the groups with low risk factors, after all they must have achieved 5 good GCSEs and that probably meant good attendance at KS4. It would also be interesting to know how many teachers had declared special needs at secondary school – perhaps Teachers Tapp could ask that question?

With little experience of risk factors, and, I guess, a training curriculum that devotes little time to how to motivate those at a high risk of becoming a NEET, perhaps we ought not to be surprised that the present labour market offers few opportunities for those without qualifications, especially now that hospitality an retail are sectors shedding jobs not offering opportunities.

Discipline in schools – the latest data around suspensions and exclusions in one area

Now that the local elections are out of the way, it is time to consider other issues – However, I might blog about my thoughts about schooling when all the results have been published and considered.

Earlier this week the DfE published data for exclusion and suspensions by schools for the spring term 202425; i.e. last year. The data came along with time series data for spring terms back to before the covid pandemic, indeed, starting in 2016-2017 school-year; the spring of 2017. Create your own tables on suspensions and permanent exclusions in england – Explore education statistics – GOV.UK

It is worth recalling that during the period under review by the DfE school rolls across the secondary sector have been on the increase, mostly as a result of the earlier rise in the birthrate. Some areas, including the one under consideration have also experienced a significant housebuilding boom for most of the period under review. New housing usually means more pupils.

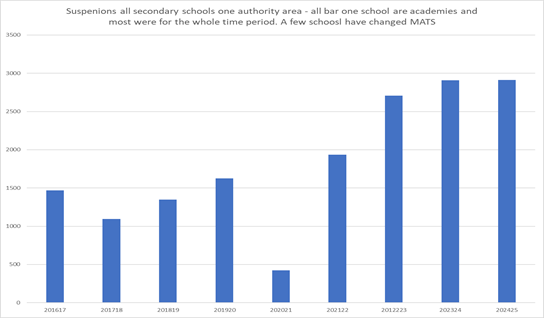
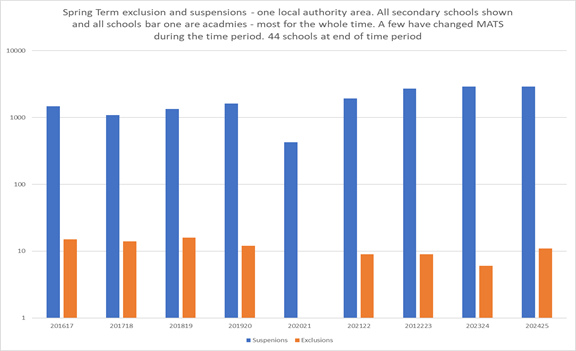
I looked at the data for both suspensions and exclusions for all the secondary schools in one current local authority area. All but one school are currently academies, and most have been for the whole of the time period. Some schools have changed academy trusts during the time period, and three new schools have opened during the period, and one 14-18 school has closed.

The schools already had noticeable numbers of suspensions before the covid pandemic. Since then, the numbers each year have been much higher, than before the pandemic, as shown in the chart.

The last three years for which data are available witness record numbers of suspensions, although not all schools have increased suspensions at the same rate. The range in the spring term 202425 was from one school with just 6 suspensions, to another with 291, albeit, this was one of the largest schools in the authority. However, it was not an urban school. Eight schools each recorded more than 100 suspensions in the spring term of 202425.

The picture for exclusions is much more encouraging, as can be seen on the following chart. This uses a logarithmic scale to plot both suspensions and exclusions. Exclusions across the authority have rarely exceeded ten in a spring term.

Of course, the total of suspensions for any one school can include multiple suspensions for the same pupil. The length of the spring term can also be affected by the changing date of Easter each year. This factor might have a small effect on each year’s data.

Of course, some pupils may not be ‘excluded’ at all, and hence not feature in these charts, but may be voluntarily removed to ‘home schooling’ by their parents. Whatever happens to pupils suspended or excluded, not being in school is more likely to see them become involved in a life of crime, often more serious crime than if they were in school on a regular basis.

Do some academy trusts have higher rates of suspension than other trusts among their schools? This is a challenging question to answer because it is clear that there is more likely to be a relationship between suspensions and the IDACI group in which the schools sits than the nature of the controlling MAT. However, it is clear than becoming an academy is not a panacea for solving the discipline issue of a school; at least as far as academies in this authority are concerned.  

Are suspension rates now on the way down? I hope so, but an not yet convinced that is the direction of travel. Time will tell.

Do children attend school?

The latest DfE repot of parent and student views contains some data that are at odds with the general perception of schooling. The data on attendance in the ‘voice’ results are so at odds with the general perception that it raises questions about who completes this sort of questionnaire. Parent, pupil and learner voice: May 2025 – GOV.UK

Generally, the perception is that fewer children are attending school on a regular basis. But here is the DfE’s evidence from their survey.

Across previous academic years, the proportions of pupils and learners who said they had been to school every day or most days were:

WaveKey stage 3 pupilsKey stage 4 pupils16-19 pupils and learners
2025-0596%95%84%
2025-0395%93%92%
2024-0997%96%
2024-0395%95%
2023-1296%94%

And for the parents the data are even more out of line with reality

Across previous academic years, the proportions of parents who said that their child had been to school every day or most days were:

WavePrimary parentsSecondary parentsSpecial parents
2025-0599%95%93%
2024-0998%96%91%
2024-0398%95%93%
2023-1299%95%91%

Would that 99% of primary pupils attended school that often. The reduction of only one per cent for the secondary sector parents between September 2024 and May 2025, from 96% to 95% even with sample sizes of more than 3,000 for both pupils and parents does seem a little out of line with the views coming from schools more generally about attendance.

Sickness or study leave were the two reasons given most frequently for absence by pupils and learners, followed by other reasons, where 16-19s had the highest percentage at 30%. Interestingly, 6% of the 16-19 cited the cost of travel, something this blog has highlighted as an issue.

Percentages for bullying s a reason for absence were low, at 5% of KS3, and 3% of KS4 pupils, compared with one per cent of KS3 parents, but 8% of KS4 parents: a big difference between pupil and parent responders.

Similarly, only 4% of KS3, and 3% of KS4 pupils, cited suspension or exclusion as reasons for missing school. Interestingly no parents of KS3 pupils, but 5% of KS4 pupils, cited suspension or exclusion as a reason for missing school.  

Tables 8 & 9 of the Technical Document on the Methodology contain the information about the percentage of parents and pupils that completed each wave, although no other information about their characteristics is forthcoming. This is despite the careful sampling frame developed to take account of a large number of different variables.  Parent, Pupil and Learner Voice Technical Report: September 2025

This does raise the question around who completes questionnaires and might the missing groups have had different responses? I cannot help but wonder whether the issue of response rates might have been more prominently discussed.  However, we all know persuading those sent questionnaires to return them is always a tricky task, so any responses are better than none.

Is discipline worse in schools?

It was interesting to hear Laura McInerney and Tom Bennett on the ‘Today’ programme on BBC Radio 4 this morning discussing whether or not behaviour was worse in schools these days than in the past. Both are experienced commentators, and Tom led a review in 2017 for the then government, about behaviour in schools. It is also interesting to see the BBC taking an interest in schools. The World at One last Sunday (also BBC Radio 4) devoted the whole of the programme to an analysis of the SEND issue. Interestingly, there was no government spokesperson available on Sunday, so they had to make do with the chair of the Education Select Committee.

The discussion this morning was around whether or not behaviour had worsened in schools, and if so, why? The usual suspects, covid and mobile phones were trotted out in support of discipline being worse in schools, along with families facing multiple challenges, but there were precious few facts.

One way of measuring the state of discipline in schools is by looking at the number of permanent exclusions each year by schools.  The largest single reason each year for these exclusions is always ‘persistent disruptive behaviour’. So, this might be seen as a good proxy measure for how schools are faring in relation to discipline in the classrooms. Of course, this measure doesn’t pick up low level disruptive behaviour, but it is reasonable to assume that there is a correlation between the different levels of behaviour in schools.

Looking back over the past 30 years, the level of recorded permanent exclusions was 10,440 in 1998/99. The level fell to 5,040 in 2010/11. In the latest year, 2023/24 there were 10,885 permanent exclusions. On the face of it, discipline is getting worse again, but is only back to levels last seen at the end of the last century.

I would like to suggest to causes not mentioned on the ‘Today’ programme: teacher supply and school funding. Is there a causal relationship between the fact that permanent exclusions were at their lowest when schools were fully staffed, and had experienced a period of several years of significant funding by government.  By contract, permanent exclusions seem to rise when there is difficulty staffing schools, and when funding is less than might be expected in a civilised society.

So, is the answer as simple as proper funding and staffing if you want fewer exclusions? The age and experience of the teaching force might also play a part. More experienced teachers, as I can testify from personal experience, are much less likely to face discipline issues then new entrants, especially if they are unqualified.

In the latest statistics on exclusions, 13 of the 25 local authorities with the lowest rates of permanent exclusions were London boroughs. This just adds more evidence to my thesis that if the rest of the country were funded like London, schooling would be in a much better place across the country.  Although I was also pleased to see Oxfordshire in 10th place overall for the lowest rate of permanent exclusions.

Do better funded schools exclude fewer pupils?

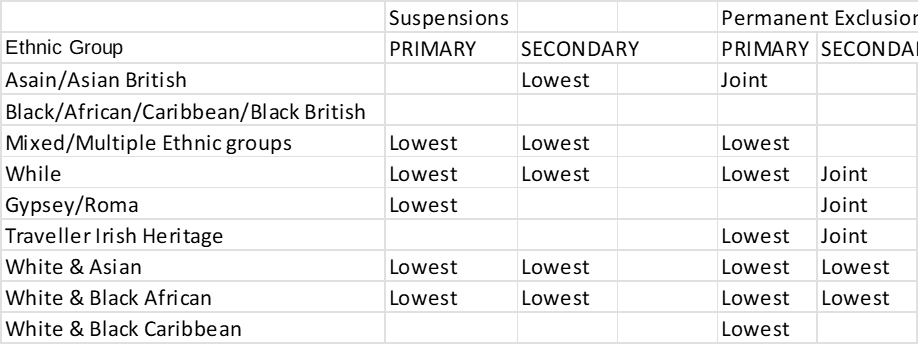
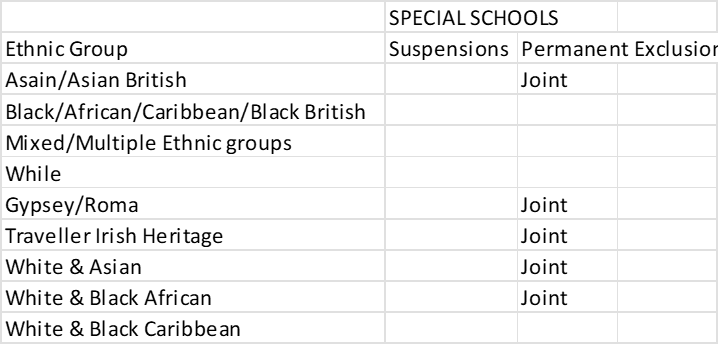
The DfE published the annual data for exclusions and suspensions from schools during the 2023/24 school-year this week. Suspensions and permanent exclusions in England: 2023 to 2024 – GOV.UK Sadly, there are more pupils being excluded than in recent years, and my post from July 2018 Bad news on exclusions | John Howson reflects much , at least at the national level, of what is contained in the latest report on 2023/24. Boys on free school meals, and with SEND, and from a minority group are at highest risk of being excluded, especially when they are in Year 9, and, as ever, the reasons is most likely to have been ‘persistent disruptive behaviour’.

With the worsening recruitment crisis in schools, allied to a challenging financial environment, an increase in exclusions and suspensions was to be expected. What the data doesn’t tell us is whether schools with high exclusion rates are linked to specific academy trusts, and also to high levels of teacher turnover.

I wrote a blog about policies for reducing exclusions in May Reducing exclusions from schools | John Howson and I would hope that if the staffing situation does settle down, so might the number of pupils being banished from school.

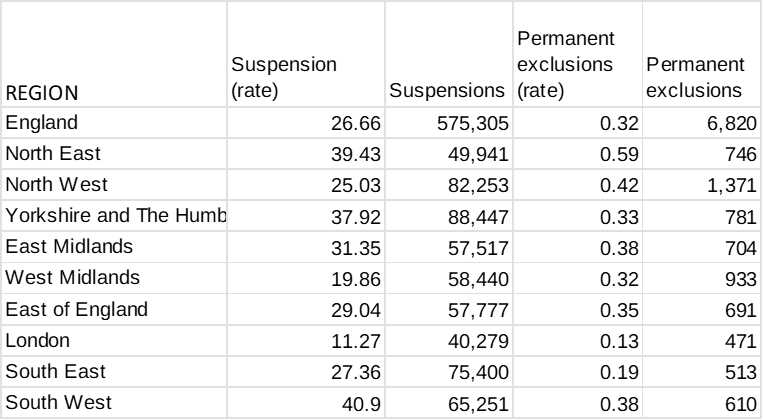
As ever, I am struck by the funding issue. London, the best funded part of England has some of the lowest rates for exclusion and suspensions. There are 17 London boroughs in the list of the 25 local authorities with the lowest rate of suspensions in 2023/24, and 19 in the similar list for secondary exclusions. In the list of ten local authorities with the highest rates of exclusion are five authorities in the North East. I think that there may be something in this data that needs further exploration, especially as I would expect teacher recruitment to be easier in the North East than in London.

Interestingly, in view of the debate about mobile phones in schools, the number of suspensions for ‘inappropriate use of social media or online technology’ only increased from 11,419 to 11,614, an insignificant change between 2022/23 and 2023/24 especially compared with the increase in exclusions for ‘persistent disruptive behaviour’ from 446,676 to 569,921 over the same period. Of course, much comes down t how a decision on which box to tick when the exclusion is being reported and the latter category may hide suspensions that actually belong in one of the other categories. This is the risk when there are too many choices for a school to make.

The increase of around 25,000 in assaults leading to suspensions must be very worrying, although I wonder whether most are ‘common assault’ rather than ‘assault leading to actually bodily harm’ or ’GBH’ to use the criminal code levels of violence against another.

Some numbers are so small it is a wonder that they are still collected. Were only 69 pupils – up from 50 the previous year- permanently excluded for theft. Perhaps schools have nothing worth nicking these days.

I hope that next year, we might read of at least a levelling out of the rates of exclusions and suspensions and perhaps a return to a downward trend, especially if there is a relationship between funding and how schools can cope with disruptive pupils.  

Reducing exclusions from schools

Reading the Youth Justice Board Bulletin this week alerted me to a new publication about a piece of research into exclusions by schools led by the University of Oxford. Equity-by-Design_Excluded-Lives.pdf  The report contains the following in its conclusion

‘Addressing inequality in education requires a radical rethink that shifts the focus from accountability on school academic performance to accountability for the inclusion and wellbeing of the child in balance with achievement and attainment. We believe that ‘Equity by Design: Our Children, Our Responsibility’ contributes to this essential process’. (page 8)

The report also notes that ‘The challenge for schools in England and the current Labour government in its policy development is how to address issues of equity and inclusion in schools in a period of multiple pressures on school leaders and staff, their pupils, and available resources. These pressures are reflected in high and rising levels of exclusion that disproportionately affect vulnerable and marginalised children and their communities.’

All worthy stuff, but the lack of a focus on staffing in schools, especially in view of the interactions with adults being the most common reasons for an exclusion was a bit of a surprise to me.

Training from Initial Teacher Education/Initial Teacher Training to the National Professional Qualification for Headship should address inclusive and relational practice and its implications for teaching and learning, behaviour policies, and pastoral care, as relevant to the context, role, and stage of professional development of staff.’

I found their conclusions on staffing wordier that useful. I hope they meant that all staff need to be trained to be aware of circumstances that might escalate into an exclusion, and that training should be tailored to the circumstances of the school. It is important for schools to identify what percentage of exclusions result from interactions with non-teaching staff that don’t seem to rate a mention in the report.

Still, the support in the report for a collaborative approach that involved local authorities did cheer me up.

‘Local area collaborative infrastructure models.

In order to tackle what we identified as the somewhat fragmented middle tier, policy development should encourage and enable trusts, schools, AP, FE, LAs, Local Inclusion Boards, and Family Hubs to form local partnership ‘Inclusion Groups’ based on collaborative working and the sharing of learning with joint accountability for decisions.

The remit of these ‘Inclusion Groups’ would be to collaboratively identify local needs and to reconfigure where responsibilities should lie to address and meet these needs. By doing so they will be able to determine provision for individuals and decide on the overall approach and its implementation.

These Inclusion Groups should enable LAs to support and challenge schools/trusts as well as empower headteachers and other partners to request action. They should also develop family hubs and other co-location models and work with local communities and third sector partners. Their work should Reviews’ and they should report back to partners annually. Additionally, the role of education should be strengthened in local multi-agency safeguarding arrangements and partnerships.’

However, I am worried about the funding for such inclusion groups and who is to take responsibility for them in the fractured world of education that exists at the present time.

With exclusions at around their highest levels for two decades, there is clearly an issue to be tackled. Personally, I think the curriculum is the best place to start. Reviewing the Key Stage 4 offering so that it provides a relevant for all pupils and not just for those aiming to stay on at school into Key Stage 5 would be a good place to begin any changes. However, we may not have the teachers to offer any radically different curriculum at the present time.

Why do some schools suspend more pupils than other schools?

The levelling up debate seems to have somewhat been overshadowed recently by the concerns about Ofsted, and the issues with worker’s pay and conditions. However, the problem of how to increase success rates for some schools hasn’t disappeared.

As I have written before on this blog, the lack of any local ability to intervene in the absence of government funding stream for levelling up, means that improvements are often haphazard, if they even happen at all. Academy chains could shunt pupils out of their schools, and leave others to cope, and failing schools have limited support outside of opportunity Areas or other places with special funding.

For a long period of time, part of Oxford city – that city of dreaming spires – has been divided into two; the generally, affluenct and successful North and West of the city, and less well-off south and east, as the ONS data from the 2021 starkly reveals. Not so much a case of the wrong side of the tracks, but the wrong side of the river Cherwell – not, note, the river Thames.

As a result, it is perhaps not much of a surprise to find that two of the state-funded secondary schools within the city – both located in the south of the city – have places in the top 200 secondary schools by the rate of suspensions during the Spring term of 2021/22 school-year. Fortunately, neither is in the top 100 schools, and for both they are probably faring better than they were a few years ago.

This an issue that the government’s Social Mobility Commission Social Mobility Commission Quarterly Commentary: March 2023 – GOV.UK (www.gov.uk) might wish to explore in some detail.

Five of the 20 local authorities with the most schools in the top 200 secondary schools are authorities with selective secondary schools. One is a south coast unitary with a disproportionately large number of its non-selective schools in the list of the top 200 schools. Like Oxfordshire, it is an authority unlikely to attract extra funding for its schools under levelling-up, but there must be an issue to explore as to why so many of its schools are in this list?

A few years ago, University Technical Colleges used to feature strongly in this type of list, but closures and presumably some better understanding of transfer at fourteen has reduced their number to four, two of them being the only schools in their authority in the list.

The extent to which feeder primary schools for these 200 schools also feature in the list would be an interesting exercise to undertake. Also, it might be interesting to ask why one county has only one school in the list, whereas an adjacent unitary has three schools?

There is something of a north-south divide in the list and relatively few schools in London are in the list: an interesting turnaround from the last century, when I am sure that there would have been more of the capital’s secondary schools in the list. No doubt, the strength of some of the academy chains located in the capital has made a difference.

Education for All

The new Report from the Education Policy Institute (EPI) about exclusions, building on their work earlier this year, is deeply worrying. https://epi.org.uk/wp-content/uploads/2019/10/Unexplained-pupil-moves_LAs-MATs_EPI-2019.pdf

Among the most concerning of EPI’s new findings are;

Amongst the 2017 cohort of pupils, we also found that approximately 24,000 children who exit to an unknown destination do not return to a state-funded school by the spring term of year 11.

The vast majority of unexplained exits do not appear to be a managed move.

51.9 per cent of all unexplained exits are to an unknown destination in the term following the exit.

Both LAs and MATs among the school groups with higher than average rates of unexplained exits, i.e. this is not a problem that is most prevalent amongst a particular structure of school governance. However larger MATs (those with at least ten schools with secondary pupils) all have above average rates of unexplained exits.

These snippets, taken from the Key Findings of a long and detailed report, suggest a system that is not operating to educate all children. Some teenagers have never been easy to educate. Indeed, challenging though schools are today most are not the same as they were up to the 1990s.

There is undoubtedly a trade-off to be had between the cost of educating challenging pupils and the funding a school receives. This trade-off may be starker in areas where Pupil Premium and High Needs Block funds are lower because of high employment and government funding calculations.

Nevertheless, the issue cannot and should not be solved by schools excluding pupils with nowhere to for them to go. EPI might also like to look at pupils that move into an area mid-year and the extent to which some of those with challenging problems are not offered school places.

The education of all our children is an issue for government to tackle. In the present governance hiatus, only central government can identify and tackle both the root causes of the problem and those schools and MATs that are the worst offenders. Ministers have been willing to take on academy trusts over the issue of high pay for Chief Executives. This is another issue for action by central government, with Ofsted, Regional School Commissioners and the Education and Skills Funding Council all acting together.

There is little local authorities can do except identify the size of the problem in their area and ensure missing children are identified and then put pressure on schools. But, with budgets largely in the hands of schools, there is little authorities can do even with maintained schools, and virtually nothing with these academy chains, often with headquarters located far away in another part of the country.

Sadly, one casualty of any intervention might be the right of genuine home schoolers to educate their children as they see fit without the need to keep the authorities informed. This principle goes back to 1870 and the start of state education. However, it must be at risk if it allows for a system that lets so many young people disappear from sight before the end of their statutory education. Out of sight must not mean out of mind.

Off-rolling and the state of education governance

Earlier this month The Education Policy Institute published a report into unexplained pupil exits from schools https://epi.org.uk/publications-and-research/unexplained-pupil-exits/ Their paper raised the question about whether this was a growing problem? A good survey of the background to the issue, and how it has gained prominence, can be found in a House of Commons briefing paper at https://researchbriefings.parliament.uk/ResearchBriefing/Summary/CBP-8444#fullreport first published last December. For those with access to the Local Government Information Unit publications, John Fowler has also written a helpful policy briefing on the subject.

The House of Commons paper starts with a helpful explanation of the issue and why it is important.

What is ‘off-rolling’ and why are concerns being raised?

There are many reasons that children may be removed from the school roll. For example, children may legitimately be excluded from schools, move to another school that is more suitable for them, or simply move home. Parents also have the right to educate their child at home if they wish. Recent years, however, have seen concerns being raised that children are leaving school rolls in rising numbers, in particular as they approach GCSE level, because of pressures within the school system. It has been suggested that increased ‘off-rolling’ is taking place because of the impact of pupils who are likely to perform relatively poorly in their examinations on school performance measures, and because schools may be struggling to support children who need high levels of support, for example pupils with special educational needs. Off-rolling of this kind might involve children being excluded for reasons that are not legitimate, or parents being encouraged to home educate a child where they would not otherwise have chosen to do so. Excluding children from school for non-disciplinary reasons is unlawful. Children who are off-rolled may move to another school, into alternative provision, or into home education.

In the present muddled state of education governance, local authorities may no longer operate schools, but they retain residual responsibilities, not least where schooling intersects with child safety concerns. Thus, as John Fowler points out, the DfE is reviewing its statutory guidance on Children Missing Education and the requirement in the Education (Pupil Registration) Regulations 2006, as amended in 2016, in order to publish a review by 30 September 2019 of regulation 5. This is the regulation that covers the contents of the admission register, along with regulation 8 that deals with deletions from the admission register, and regulation 12 that covers information to be provided to the local authority.

In Oxfordshire, all but one of our secondary schools are now academies. What sanctions does the local authority have if schools do not comply with the requirement to notify an exit from school by a pupil, especially by a pupil at the start of Year Eleven where they still would not count towards a school’s results the following summer? A rule that has no sanctions attached is a rule that can be broken with impunity.

In an earlier post on this blog about youth justice I suggested that ‘any secondary school with more than 8% of its current annual revenue grant held in reserves and also with an above average figure for permanent exclusions across years 10 and 11 and any off-rolling of pupils in those years for pupils with SEND should have 50% of the excess of their reserves above the 8% level removed by the government and reallocated to the local Youth Offending Team.’ (March 11th 2019 post headed youth Justice)

If it is more cost effective for schools to remove challenging pupils than to retain them on roll, then there is little incentive, especially when funds are tight, to keep to either the letter or the spirit of the law. At the next Cabinet meeting in Oxfordshire I will be probing this matter further through a tabled question.


Support Youth Justice

One of the success stories of the past decade has been the reduction in the number of young people held in custody, both on remand and after sentencing. Sadly, with the present increase in ‘knife’ crime that trend may well be reversed over the coming few months.

Perhaps the increase in violent crime might have been reduced in scale had the Funding to help local authorities keep young people away from crime and re-offending not been halved since 2010. Youth justice grants, which fund council youth offending teams, have been reduced from £145m in 2010-11 to £71.5m in 2018-19, according to the Local Government Association. Furthermore, even though councils have already set their budgets for 2019-20, they are still awaiting their allocations for youth justice grants, thus, according to the Local Government Association, making it “extremely difficult” to plan services aimed at preventing gangs and violent crime.

Now it stands to reason that although the number of young people entering the youth Justice system is sharply down on the terrible days of the Labour government – by some 86% for the drop in first time entrants to the youth justice system – again according to the Local Government Association, many already in the system may be continuing to reoffend. . https://www.publicfinance.co.uk/news/2019/03/youth-offending-team-funding-halved?utm_source=Adestra&utm_medium=email&utm_term=

Cutting the grant for Youth Justice Services seems like another short-sighted attempt to save cash, where it may have actually had the opposite result in practice. Youth offending teams cannot devise schemes to held reduce re-offing, especially among what used to be termed ‘persistent young offenders’ if they no longer have the funds to do their work.

So, here is a suggestion. Any secondary school with more than 8% of its current annual revenue grant held in reserves and also with an above average figure for permanent exclusions across years 10 and 11 and any off-rolling of pupils in those years for pupils with SEND should have 50% of the excess of their reserves above the 8% level removed by the government and reallocated to the local Youth Offending Team.

Yes, the suggestion is crude, and if it catches any genuine cases, then the local Youth Offending Team can work with those schools to reallocate the funds to appropriate programmes.

This is a one-off short-term solution to allow government, in this time of policy paralysis, to find a better long-term solution to the increase in crime among teenagers and the cash to support new programmes over the longer-term.

At present, although more schools are reporting deficits, some have put money aside for a rainy day in a prudent manner, these latter group of schools would only be affected under these proposals if they had also shifted the burden of educating some challenging pupils onto others.

Cash in reserves is sterile public money, and with a need to deal with the present increase in violent crime, something needs to be done and quickly. Of course, if the government can find new cash in the Spring Statement my solution won’t be necessary.