For years one of the features of the DfE’s vacancy website that has irritated me is the seemingly random repeating of vacancies. The example below, seen this morning, is an extreme example of this tendency, with the two adverts for the same vacancy appearing next to each other on the same page. I never know whether this is either a coding glitch that has existed since the site became active or a deliberate attempt to ensure some vacancies are repeated in case viewers missed them on their first appearance in the listing or search. Either way, putting the two versions next to each other doesn’t seem to me to be sensible.
Bordesley Green Girls’ School & Sixth Form, Birmingham, B9 4TR
Full-time equivalent salary
L33 to L39
School type
Local authority maintained school, ages 11 to 18
Working pattern
Full time
Closing date
30 June 2026 at 9am
Visa sponsorship
Visas cannot be sponsored
Bordesley Green Girls’ School & Sixth Form, Birmingham, B9 4TR
Pay scale
L33 to L39
School type
Local authority maintained school, ages 11 to 18
Working pattern
Full time
Closing date
30 June 2026 at 9am
Visa sponsorship
Visas cannot be sponsored
Another irritation of the DfE vacancy site, as far as I am concerned, is that a search on the term ‘headteacher’ can result in random vacancies for other posts appearing in the search, such as this on today for an ‘assistant principal’. This is not an issue at this time of year when there are few vacancies on the site, but is more of an issue when there are a couple of hundred vacancies to consider.
Assistant Principal – Behaviour and Alternative Provision
More than one location, Archway Learning Trust
Full-time equivalent salary
From £67,898 to £75,049 per annum
School type
1 academy, None, ages 11 to 19
Working pattern
Full time
Closing date
6 July 2026 at 9am
Visa sponsorship
Visas cannot be sponsored
Both the issues mentioned here may cause problems for AI generated searches aimed at counting the number of vacancies for particular post. The search mechanism would need to be very sophisticated to cope with such anomalies.
This is the reason why, at present, I still spend a couple of hours a week studying the list of vacancies. I would be delighted if anyone would provide me with a foolproof automated regime to collect vacancies, because forty years of collecting headteacher vacancies has taught me that it is not a straightforward exercise.
Later next month, when I come to write my annual report of the 2025/26 school-year and headteacher vacancies, I will discuss some of those issues in more detail, including ‘what is an Executive headteacher’ and do we need a definition?
Meanwhile, I have collected data on just under 1,400 nursery, primary, secondary and special schools that are state-funded and located in England and have advertised for a head teacher since 1st August 2025.
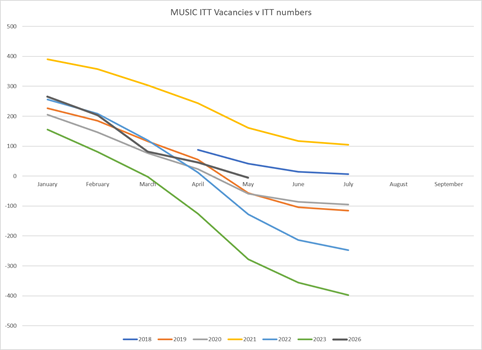
Since January, I have also been collecting data about vacancies for teachers of music in state-funded secondary schools. Next year, I might expand that to include private schools so that I can understand the completion for teachers across both sectors.
Watch our for the report that will be published either in Late July or August this year.