London schools and challenging pupils: better outcomes than elsewhere?

Yesterday, I wrote a blog post about the rate of exclusions and suspensions from schools in London and the other regions of England of pupils eligible for Free School Meals as a part of a series about whether better funded schools were able to keep more of their pupils in schools. As promised in that post, I have also looked at the position with regard to the main ethnic, groups and a few of the less considered sub-grouping. Are London schools overfunded? | John Howson

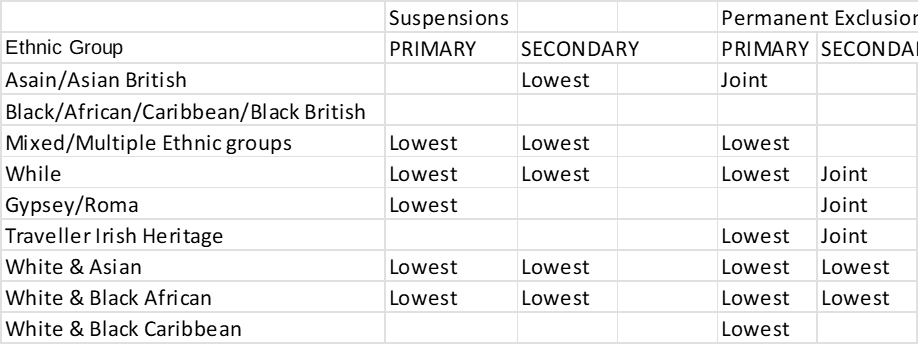
As the following table shows, the picture for London is much more mixed with respect to the different ethnic groupings than for pupils eligible for Free School Meals.

London had the lowest rate of suspensions for five ethnic groups in the primary school sector, and four in the secondary school sector.

In respect of permanent exclusions, where rates are generally very low, and a single exclusion can affect the rate significantly, London had the lowest rate in six of the nine ethnic groups for the primary school sector and was joint equal in a seventh group. In the secondary school sector, London had the lowest rate in only two categories, but was joint lowest in another three groups- mostly were there were no permanent exclusions in this group in a number of regions, including London.

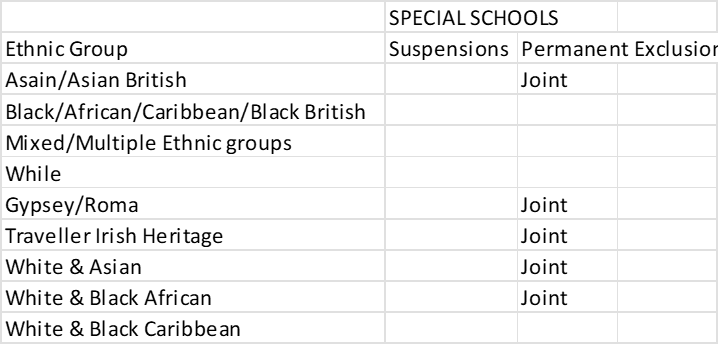
The position in special schools was somewhat different, as shown in the table.

London was not the lowest region in any ethnic grouping in ‘suspensions’ in the special school sector, and was only joint lowest in ‘permanent exclusions’. In most cases there were no permanent exclusions in these groups in any of the regions listed as ‘joint’ lowest, including in the London region. As pupils may attend some special schools from different local authorities to that where they live, and the funding for such schools is not through the  ‘School Block’ but was through the discredited ‘High Needs Block’, it is difficult to read anything into the results for the special school sector, except to say that no other region has the same level of outcome as the London region.

London schools contain a much more ethnically diverse group of pupils than schools in some other of the English regions, notably the North East and South West regions. Despite this fact, or possible because the familiarity of dealing with pupils from a wide range of different ethnic groups, often in the same classroom, and sometimes having come to school in England from war-tern or other challenging environments, have meant policies are in place to deal with situations that were less common outside the capital’s schools, London as a region still outperformed any other region in terms of being in lowest place of any region either on its own or in joint lowest position.

One can wonder: is this due to the funding being better than elsewhere? The funding formula school prevent that outcome for primary and secondary schools, if not for special schools. However, as I asked in the previous post in this series, is it the fact that funding includes a London allowance important, as the extra cash may go further if London schools employ younger, and thus cheaper teachers than in some other parts of England.

Do London schools use their cash for more classroom assistants and other staff likely to help reduce the level of suspensions and exclusions?

The data is intriguing, and worthy of more analysis than I have time to undertake. Are there also lesson to be learnt from London schools about how to reduce the number of pupils ‘kicked out’ of schools?

Finally, do academies or maintained schools exclude or suspend more pupils in different groups of pupils? What role, if any, do local authorities still play in helping keep down the levels of suspensions and exclusions? Time for me to go search the research literature.

Are London schools overfunded?

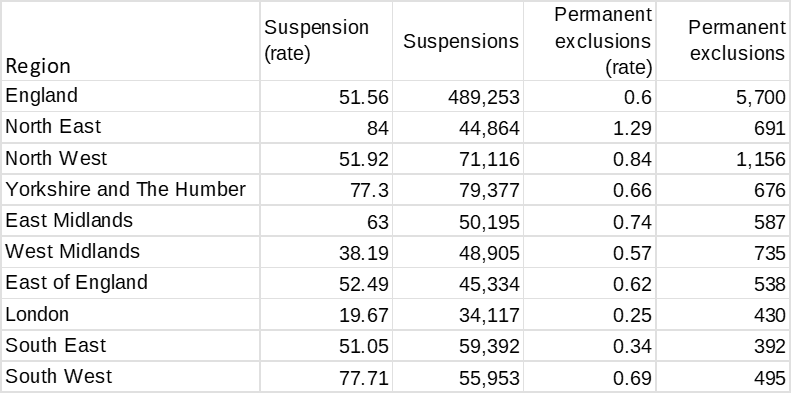
Let me be clear the answer is, of course they are not. However, as my previous post showed, there were significant differences in exclusion and suspension rates in the latest DfE data between many London boroughs and other local authorities across England. Do better funded schools exclude fewer pupils? Part 2 | John Howson with London borough having some of the lowest levels of both exclusions and suspensions.

This discrepancy between London and the rest of England, prompted me to explore the data at a regional level on two different factors: ethnicity and Free School Meals. At some point, it might be interesting to combine these two factors, but for now, they are treated as separate factors. This post deals with pupils eligible for Free School Meals. I hope, in a later post, to consider the data about ethnicity, where the are significant differences between different ethnic groups.

Firstly, here is the table for outcomes for entitle pupils for Free School Meals across primary, secondary and special school sectors.

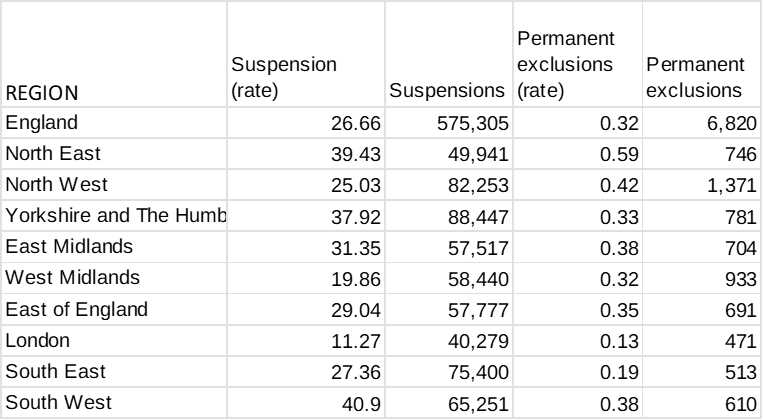
Free School Meal – entitled pupils 2024/25 All school sectors

London stands out as the lowest rate for both exclusions and suspensions of any region in England. Permanent exclusions in the North East are more than four times higher than the rate in London, and even suspensions are more than four times higher than in the London region.

Of course, London schools may use other sanctions, such as in-school suspensions, but the differences do seem stark between the regions, with London schools using less than half the rate of suspensions of schools across any other region.    

In terms of pupils not entitled to Free School Meals, the differences between London and the rest of the regions are less stark.

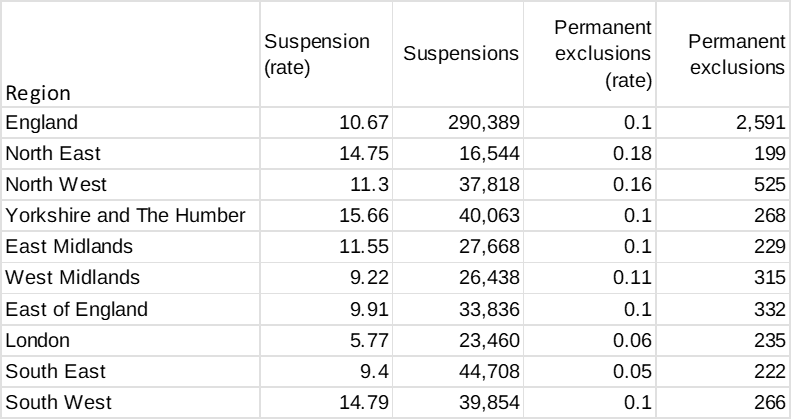
Free School Meal – non-entitled pupils 2024/25 All school sectors

However, London still has a ‘suspension rate’ of less than half of that in the three regions with the highest rate of suspensions. Permanent exclusion rates for pupils not eligible for Free School Meals are generally very low across England, but, even so, London, along with the South East still had the lowest rate of permanent exclusions in 2024/25.

Free School Meal – non-entitled pupils 2024/25 Primary school sector

London doesn’t quite have the lowest permanent exclusions in the primary sector for pupils not entitled to Free School Meals: the rate in the south East is 0.01 better than in London. However, London does have the lowest rate for suspensions.

Free School Meal – entitled pupils 2024/25 Secondary school sector

Even with secondary school pupils entitled to Free School Meals, London has both the lowest rate of suspensions and of permanent exclusions o any region in England. Again, whether this is as a result other in-school measures, better staffing because of funding, or some other reasons isn’t discernible for the data.  

However, it will be interesting to consider the data for ‘ethnicity’ where London is one of the more diverse regions of England. This is because some London boroughs have low percentages of pupils on Free School Meals.

Does the funding of schools on a model of average salary funding model, with an additional London weighting in the National Funding Formula play any part in this data? For instance, does London employ more new teachers at below average salary rates.

Going forward, how will falling rolls affect the finances of schools in London and, hence, the possible rate of suspensions and exclusions in future years?

Do better funded schools exclude fewer pupils? Part 2

Earlier this week the DfE published the 2024-25 school-year data about temporary suspensions and permanent exclusions by schools. Release home – Suspensions and permanent exclusions in England – Explore education statistics – GOV.UK

The good news is contained in the headlines:

The rate of suspensions in the 2024/25 academic year was 10.88 (equivalent to 1,088 suspensions for every 10,000 pupils). This is a decrease from 11.31 in 2023/24. There were 913,000 suspensions in 2024/25, a decrease of 4% from 955,000 in 2023/24.

The rate and number of permanent exclusions also decreased from 2023/24 to 2024/25

The rate of permanent exclusions in the 2024/25 academic year was 0.12 (equivalent to 12 permanent exclusions for every 10,000 pupils). This is a decrease from 0.13 in 2023/24. There were 9,900 permanent exclusions in 2024/25, a decrease of 9% from 10,900 in 2023/24.

As the data are per 10,000 pupils, the outcomes are not affected by falling pupil rolls. However, since falling pupil numbers have yet really impacted on the secondary school sector, where most pupils are excluded or suspended, I wouldn’t have expected falling rolls to have had an impact in 2024-25.

A more interesting questions is whether funding for schools plays any part in the ability of schools to retain pupils rather than suspend or exclude them. Answering this question is slightly more complex than it might be because not all schools may behave in the same manner. for instance, Oxfordshire, a county I know well, has a higher rate of temporary suspensions, where it ranked 83 worst out of 154 local authorities in the 2024-25 data, compared with a ranking of 11th best of the 154 authorities for permanent exclusions.

However, as I have shown before, London schools are well funded compared with schools outside the capital. Thus, without a deliberate local policy to try to reduce either exclusion and suspensions, or indeed both, by schools outside the capital, it might be expected that London local authorities might rank as authorities with the lowest percentages of exclusions and suspensions.

The data for the rankings of London authorities in both 2023-24 and 2024-25 are shown in the table.

NUMBER OF LONDON BOROUGHS IN THE TOP 35 RANKED LOCAL AUTHORITIES
SCHOOL YEAR PERM EXCLUSIONS TEMP SUSPENSIONS
202324 19 27
202425 16 28

The figures for both years are impressive, with 28 of the London boroughs in the top 35 local authorities for the lowest temporary suspension per 10,000 pupils. However, this is not a new trend. In a previous post last year, I wrote the following:

As ever, I am struck by the funding issue. London, the best funded part of England has some of the lowest rates for exclusion and suspensions. There are 17 London boroughs in the list of the 25 local authorities with the lowest rate of suspensions in 2023/24, and 19 in the similar list for secondary exclusions. In the list of ten local authorities with the highest rates of exclusion are five authorities in the North East. I think that there may be something in this data that needs further exploration, especially as I would expect teacher recruitment to be easier in the North East than in London. Do better funded schools exclude fewer pupils? | John Howson

Once again, in the latest data, local authorities  in the north East fare badly, with five in the ten lowest rankings for permanent exclusions, and six in the ten lowest rankings for temporary suspensions.

Many London schools also have the benefit of Teach First in addition to their DfE funding. Even though they have to pay towards the Teach First trainees, the extra support is possibly another reason why London schools perform so well on this measure.

I wonder whether this issue is a concern to our incoming Prime Minister in view of the rankings for some local authorities in the north West of England.

Children’s Wellbeing and Schools Act 2026 – misconduct

S52 of the new Act deals has made changes to the scope of teacher misconduct. Three things to note

The term teacher is still not a reserved occupation term: anyone can still call themselves a teacher., but if they do so, they will more likely now be caught by the widened provision, unless that is they are self-employed offering only tutoring. Should such tutors also be covered by misconduct regulations, or just subject to the general criminal law?

Clause 52 of the Children’s Wellbeing and Schools Act 2026 widens the scope of those within the compass of the new section on misconduct as a teacher to include:

“a person who employs or engages a person to teach at an institution within the further education sector, an independent training provider or an online education provider.”

and hence these ‘teachers’ now become liable to be brought before The Teacher Regulation Agency for a hearing into misconduct

The legislation confirms that action outside of employment may trigger a misconduct hearing

“(3A) For the purposes of subsection (1)(a) or (b) it is irrelevant whether the conduct occurred, or the offence was committed, at a time when the person was employed or engaged to carry out teaching work or at some other time.

That’s pretty draconian, but not surprising in view of the need for child safety.

Of course, if the on-line provider is outside the United Kingdom, then this provision won’t apply to non-British citizens. Will it apply to British citizens working outside the United Kingdom and working for an on-line provider?

Teaching work has been defined as: “teaching work” means work of a kind specified in regulations under this section (and such regulations may make provision by reference to specified activities or by reference to the circumstances in which activities are carried out).”

So now you know. It could mean almost anything. This may be important now the definition of those subject to regulation has widened.

However, the test remains:

  • that it relates to a person who has been employed or engaged to carry out teaching work in England; ……
  • that the alleged conduct is capable of amounting to unacceptable professional conduct, conduct that may bring the teaching profession into disrepute or conviction, at any time, of a relevant offence and that a prohibition order may therefore be appropriate.

Will the relevant offence list be the same for someone teaching in a further education setting as for an early years’ setting? I suspect that it will be, since certification as a teacher or lecturer in further education allows anyone to teach anything to anyone or any age.

In my opinion, this makes the need for a definition of a ‘teacher’ or ‘lecturer’ as a reserved term more important. Government could, for instance. Require anyone ‘teaching’ on-line to hold the appropriate ‘qualified’ status. A new qualification for tutoring, both in person and on-line, could be devised to help regulate the industry, at least as far as UK companies are concerned. It would then be up to parents whether they wanted to use a service on-line from overseas and using unqualified staff.

Discipline in schools – the latest data around suspensions and exclusions in one area

Now that the local elections are out of the way, it is time to consider other issues – However, I might blog about my thoughts about schooling when all the results have been published and considered.

Earlier this week the DfE published data for exclusion and suspensions by schools for the spring term 202425; i.e. last year. The data came along with time series data for spring terms back to before the covid pandemic, indeed, starting in 2016-2017 school-year; the spring of 2017. Create your own tables on suspensions and permanent exclusions in england – Explore education statistics – GOV.UK

It is worth recalling that during the period under review by the DfE school rolls across the secondary sector have been on the increase, mostly as a result of the earlier rise in the birthrate. Some areas, including the one under consideration have also experienced a significant housebuilding boom for most of the period under review. New housing usually means more pupils.

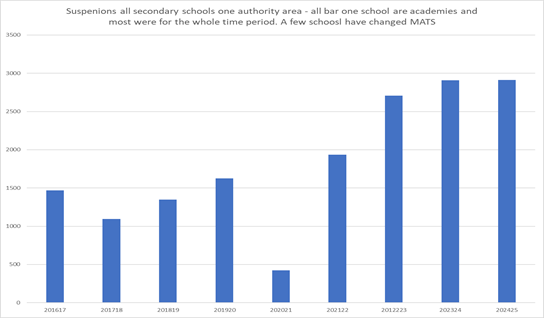
I looked at the data for both suspensions and exclusions for all the secondary schools in one current local authority area. All but one school are currently academies, and most have been for the whole of the time period. Some schools have changed academy trusts during the time period, and three new schools have opened during the period, and one 14-18 school has closed.

The schools already had noticeable numbers of suspensions before the covid pandemic. Since then, the numbers each year have been much higher, than before the pandemic, as shown in the chart.

The last three years for which data are available witness record numbers of suspensions, although not all schools have increased suspensions at the same rate. The range in the spring term 202425 was from one school with just 6 suspensions, to another with 291, albeit, this was one of the largest schools in the authority. However, it was not an urban school. Eight schools each recorded more than 100 suspensions in the spring term of 202425.

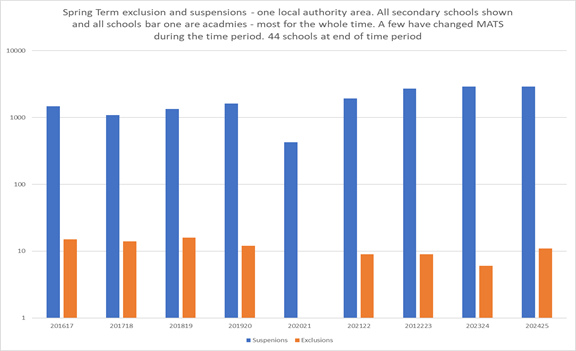
The picture for exclusions is much more encouraging, as can be seen on the following chart. This uses a logarithmic scale to plot both suspensions and exclusions. Exclusions across the authority have rarely exceeded ten in a spring term.

Of course, the total of suspensions for any one school can include multiple suspensions for the same pupil. The length of the spring term can also be affected by the changing date of Easter each year. This factor might have a small effect on each year’s data.

Of course, some pupils may not be ‘excluded’ at all, and hence not feature in these charts, but may be voluntarily removed to ‘home schooling’ by their parents. Whatever happens to pupils suspended or excluded, not being in school is more likely to see them become involved in a life of crime, often more serious crime than if they were in school on a regular basis.

Do some academy trusts have higher rates of suspension than other trusts among their schools? This is a challenging question to answer because it is clear that there is more likely to be a relationship between suspensions and the IDACI group in which the schools sits than the nature of the controlling MAT. However, it is clear than becoming an academy is not a panacea for solving the discipline issue of a school; at least as far as academies in this authority are concerned.  

Are suspension rates now on the way down? I hope so, but an not yet convinced that is the direction of travel. Time will tell.

Celebrating 100,000 Blog Visitors: A Thank You to Readers

Yesterday evening this blog received its 100,000 visitor, according to WordPress statistics. I would like to say a very big thank you to everyone that has read a post on this blog since I started it, way back in early 2013. According to Chat GPT, only 5% of blogs started in that year still survive. This blog not only survives, but is also thriving.

From time to time, WordPress suggest I make a charge to visitors to read previous posts. I have steadfastly ignored those blandishments in favour of open access for all. I am sure that policy has helped gain me extra visitors.

However, writing a blog does take time and effort, and if you know a library that might like to book of the 2013 posts, some of which WordPress no longer allows access to, please suggest they buy the book either as a e-book from Amazon or as a paperback from myself through the email at: dataforeducation@gmail.com

Once this book has covered its costs, I will publish another on the 100 most read posts – with a bit of commentary as to why they might have received so much attention. To date, posts about teachers’ holiday entitlements lead by a long way. It seems like the myth of long holidays is deeply engrained in the public’s psyche.

As someone that failed their English Language examination at age 16, I never thought that I would write a column for the TES between 1997 and 2010, and this blog since 2013. Sub-editors taught me a lot, and on-line software has helped. Interestingly, I have experimented recently with turning the text of a blog post into a webinar conversation. If you ae interested, I will leave you to search the 2026 posts for an example.   

In the past, comments were more frequent that they are these days, although ‘likes’ still seem to crop up from time to time. My thanks to those that ‘like’ every post I write. I am not used to having such a fan base.

My especially thanks to, Janet D, Frank S and Sue B for their many comments. Along with teachingbattleground, they make up the most frequent commentators over the years on my posts. Frank was at school with me, and I still remember his part in TCS plays.

Where now for the blog? Well, I hope to keep it going for some time yet, as there is certainly plenty of material to write about. My special field is the labour market for teachers and, especially, headteachers, where I have more than 40 years of data from my research. Later today, I will post, as my next blog post, about how my findings compare with a report that was published yesterday. AI can do some things, but it still has much to be taught to make it even more useful as a research tool.

So, once again, thank you to my audience, whether you have just read one post, have delved into the archive as part of research for a project, or are one of the small number of regular readers.  

30th April update

A, my thanks to you, the readers for the best April ever for the blog. 2,000 readers over the courses of the month!

Thank you.

Teaching; a well behaved profession

A recent post on LinkedIn asked about whether a ban from teaching, with the possibility of a request for reinstatement after a set period of time was appropriate as a punishment for a drink driving offence by a teacher? This set me thinking about the Teaching Regulation Agency (TRA) that oversees the handling of conduct cases against those working as teachers. The Agency also handles requests for Qualified Teacher Status. Their latest report and accounts can be found at:  Teaching Regulation Agency Annual Report and Accounts 2024-25

Drink driving cases involving teachers that come before the TRA are relatively rare. There have been around 12 hearings between January and August 2025 where this was the main issue in relation to misconduct by a teacher. Interestingly, while, overall, cases against male teachers significantly outnumber those heard against female teachers, in drink driving cases there were only three hearings against male teacher compared with nine against female teachers. In three cases no order was made, the finding of the case proved and the associated publicity were deemed enough of a sanction. In the other cases, the teacher could seek to have prohibition notice set aside after a period of between two to five years. If successful they would then be returned to the register of qualified teachers.  

The TRA annual report for 2024-25 notes that there were only four prohibition set-aside hearings during the year for any imposition of a prohibition notice, of which two were successful. So, it seems unlikely that any of these teachers will return to the profession, at least in a regulated setting. As I have noted before, ‘Teacher’ is not officially a reserved occupation terms so, rather like estate agent, anyone can use the term. I would have liked to see the present Bill before parliament provide the status of a reserved occupation to the term ’teacher’, so that only those with QTS or in training could use the title.

The most common reason for prohibition so far in 2025 is misconduct of a sexual nature. This ranges from criminal convictions for anything from rape to the taking of inappropriate photographs. More than 80 male teachers, but fewer than ten female teachers, have had cases of this type of misconduct heard so far in 2025. Most resulted in prohibition orders, with no opportunity for a set-aside request. However, a few cases did allow for requests for reinstatement after a set period. These included the two teachers that had, presumably consensual, sex on school premises.

There were relatively few cases concerning teachers or school leaders interfering with examination or SATs outcomes. Of seven such cases, five resulted on ‘No Order’ and the others a prohibition with permission to request a set-aside after two years. It might seem that the profession has got the message about the need for letting children’s work speak for itself.

Most cases of ‘improper conduct’ that are not sexual in nature have resulted in prohibition with a request for set-aside after two to three years; exceptionally it may be a five-year period that was imposed. These can include single instances of primary school teachers slapping a pupil once, although such instances are mercifully rare, and often reveal the frustration that can face any teacher at any time when in a challenging disciplinary situation.

Teacher conduct is highly regulated, and there is now a considerable body of ‘case law’, so it is not surprising that many hearing are heard ‘in absentia’ as the individual may well have been reconciled to the end of their career in teaching.

The TRA Annual Report listed 297 hearings in 2024-25, with 191 prohibition notices resulting from the hearings. For a profession of well over half a million, this is a credit to the responsible behaviour of almost everyone working as a teacher.   

Is discipline worse in schools?

It was interesting to hear Laura McInerney and Tom Bennett on the ‘Today’ programme on BBC Radio 4 this morning discussing whether or not behaviour was worse in schools these days than in the past. Both are experienced commentators, and Tom led a review in 2017 for the then government, about behaviour in schools. It is also interesting to see the BBC taking an interest in schools. The World at One last Sunday (also BBC Radio 4) devoted the whole of the programme to an analysis of the SEND issue. Interestingly, there was no government spokesperson available on Sunday, so they had to make do with the chair of the Education Select Committee.

The discussion this morning was around whether or not behaviour had worsened in schools, and if so, why? The usual suspects, covid and mobile phones were trotted out in support of discipline being worse in schools, along with families facing multiple challenges, but there were precious few facts.

One way of measuring the state of discipline in schools is by looking at the number of permanent exclusions each year by schools.  The largest single reason each year for these exclusions is always ‘persistent disruptive behaviour’. So, this might be seen as a good proxy measure for how schools are faring in relation to discipline in the classrooms. Of course, this measure doesn’t pick up low level disruptive behaviour, but it is reasonable to assume that there is a correlation between the different levels of behaviour in schools.

Looking back over the past 30 years, the level of recorded permanent exclusions was 10,440 in 1998/99. The level fell to 5,040 in 2010/11. In the latest year, 2023/24 there were 10,885 permanent exclusions. On the face of it, discipline is getting worse again, but is only back to levels last seen at the end of the last century.

I would like to suggest to causes not mentioned on the ‘Today’ programme: teacher supply and school funding. Is there a causal relationship between the fact that permanent exclusions were at their lowest when schools were fully staffed, and had experienced a period of several years of significant funding by government.  By contract, permanent exclusions seem to rise when there is difficulty staffing schools, and when funding is less than might be expected in a civilised society.

So, is the answer as simple as proper funding and staffing if you want fewer exclusions? The age and experience of the teaching force might also play a part. More experienced teachers, as I can testify from personal experience, are much less likely to face discipline issues then new entrants, especially if they are unqualified.

In the latest statistics on exclusions, 13 of the 25 local authorities with the lowest rates of permanent exclusions were London boroughs. This just adds more evidence to my thesis that if the rest of the country were funded like London, schooling would be in a much better place across the country.  Although I was also pleased to see Oxfordshire in 10th place overall for the lowest rate of permanent exclusions.

Do better funded schools exclude fewer pupils?

The DfE published the annual data for exclusions and suspensions from schools during the 2023/24 school-year this week. Suspensions and permanent exclusions in England: 2023 to 2024 – GOV.UK Sadly, there are more pupils being excluded than in recent years, and my post from July 2018 Bad news on exclusions | John Howson reflects much , at least at the national level, of what is contained in the latest report on 2023/24. Boys on free school meals, and with SEND, and from a minority group are at highest risk of being excluded, especially when they are in Year 9, and, as ever, the reasons is most likely to have been ‘persistent disruptive behaviour’.

With the worsening recruitment crisis in schools, allied to a challenging financial environment, an increase in exclusions and suspensions was to be expected. What the data doesn’t tell us is whether schools with high exclusion rates are linked to specific academy trusts, and also to high levels of teacher turnover.

I wrote a blog about policies for reducing exclusions in May Reducing exclusions from schools | John Howson and I would hope that if the staffing situation does settle down, so might the number of pupils being banished from school.

As ever, I am struck by the funding issue. London, the best funded part of England has some of the lowest rates for exclusion and suspensions. There are 17 London boroughs in the list of the 25 local authorities with the lowest rate of suspensions in 2023/24, and 19 in the similar list for secondary exclusions. In the list of ten local authorities with the highest rates of exclusion are five authorities in the North East. I think that there may be something in this data that needs further exploration, especially as I would expect teacher recruitment to be easier in the North East than in London.

Interestingly, in view of the debate about mobile phones in schools, the number of suspensions for ‘inappropriate use of social media or online technology’ only increased from 11,419 to 11,614, an insignificant change between 2022/23 and 2023/24 especially compared with the increase in exclusions for ‘persistent disruptive behaviour’ from 446,676 to 569,921 over the same period. Of course, much comes down t how a decision on which box to tick when the exclusion is being reported and the latter category may hide suspensions that actually belong in one of the other categories. This is the risk when there are too many choices for a school to make.

The increase of around 25,000 in assaults leading to suspensions must be very worrying, although I wonder whether most are ‘common assault’ rather than ‘assault leading to actually bodily harm’ or ’GBH’ to use the criminal code levels of violence against another.

Some numbers are so small it is a wonder that they are still collected. Were only 69 pupils – up from 50 the previous year- permanently excluded for theft. Perhaps schools have nothing worth nicking these days.

I hope that next year, we might read of at least a levelling out of the rates of exclusions and suspensions and perhaps a return to a downward trend, especially if there is a relationship between funding and how schools can cope with disruptive pupils.  

Are teachers losing control of classrooms?

A recurrent theme running through the recent DfE’s ‘Working lives of teachers and leaders: wave 3 Summary report November 2024’ Working lives of teachers and leaders: wave 3 – GOV.UK is that teachers seem less happy about pupil behaviour than in the previous reports.

In this report, 44% of leavers from teaching cited pupil behaviour as a reason, up from 32% in the previous study and a statically significant change compared to the 2024 study. Not yet at the level of ‘high workload’, cited by 84% this year, up from 80% last year and the top reason in both years.

Nor is it yet at the 47% level of those citing government initiatives/policy changes, although it is worth noting that eight per cent fewer leavers cited this reason this year compared with last year.

Other pressures and stress are still also at the top of leavers reasons for quitting, but dissatisfaction with pay, never near the top of the list of reasons fell by five per centage points to 34%. No doubt both the government and the professional associations will be looking closely at that figure as will be those advising the School Teachers Review Body. Conditions of service seem more of a concern than pay at this point in time.

The point about pupil behaviour is reinforced in the table showing the views about discipline deteriorating among both teachers and school leaders completing the survey. In the 2022 survey 18% of teachers and 5% of leaders said that pupil behaviour was either ‘poor’ or ‘very poor’.  By the 2024 survey the reporting levels were 27% and 8%,

It would be interesting to know more about his change. Is it across all teachers and leaders; worse in the secondary sector than primary schools and what, if any, role has increased absence rates played in deteriorating views of pupil behaviour?

Perhaps more worrying was the findings that although

“around eight-in-ten (79%) leaders with teaching responsibilities reported that they felt always or mostly supported to deal with disruptive behaviour (consistent with the 80% in 2023 but lower than the 85% in 2022).”

But those bearing the brunt of classroom teaching, teachers with teaching responsibilities were less positive,

 “with 49% reporting feeling always or mostly supported with dealing with disruptive behaviour (lower than the 52% in 2023 and 58% in 2022).”

Not surprisingly, there have been declines in those teachers and school leaders viewing classroom behaviour as very good over the same period.

Is this change a consequence of the deteriorating staffing situation in secondary schools in recent year, or is it a reflection of the debate about mobile phone use in the classroom? It would be interesting to know more about the types of school and ages of the teachers reporting the deterioration in pupil behaviour to see how widespread the decline is among teachers.

At these levels this is certainly a flashing amber light, but not yet a full-blown crisis, but all concerned will need to understand the reasons why classroom behaviour is deteriorating.