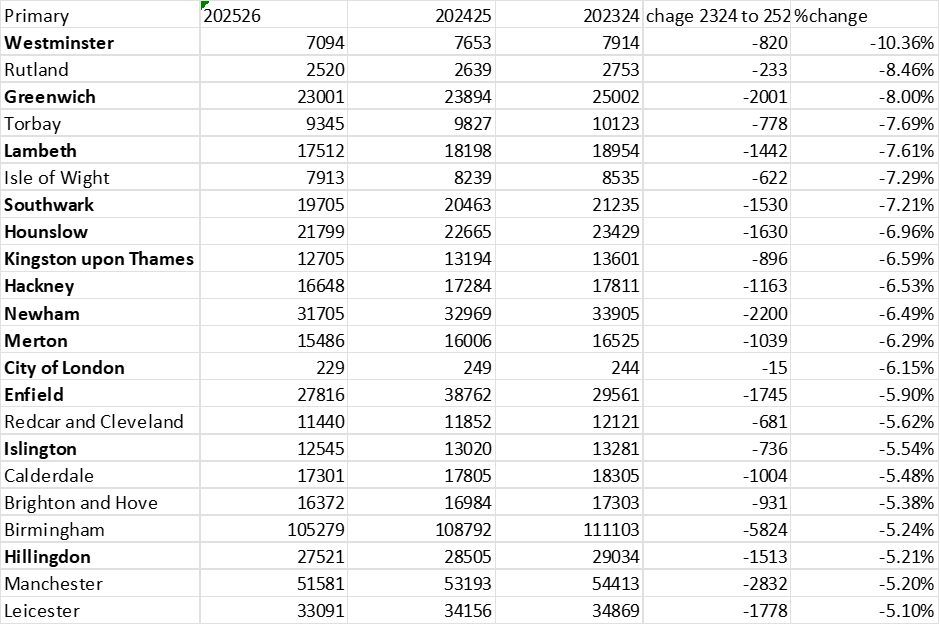
The DfE’s June data on the current round of applications and offers for postgraduate ITT courses still revels that the 2026 round is separating into two distinct sections. Subjects where applications are likely to come from anywhere in the world are either already meeting their Teacher Supply Model target for 2026 entry, or should do so on the current trajectory. Subjects where home recruitment is likely to dominate applications seem more at risk of missing their targets.
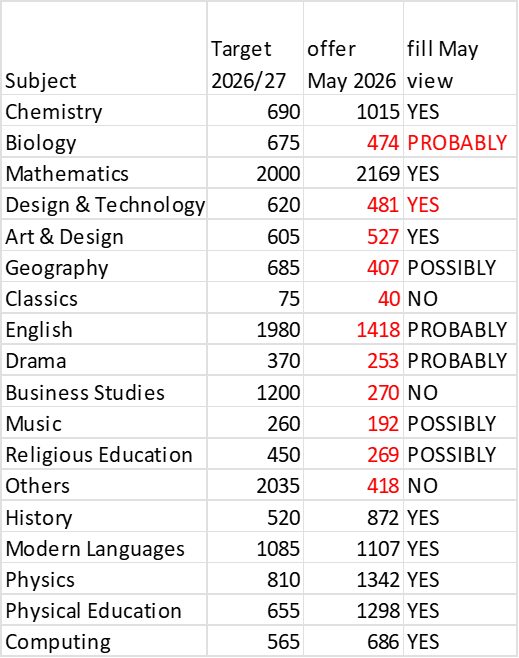
| Subject | Target 2026/27 | offer May 2026 | Fill: May view | June offers | Fill: June view |
| Chemistry | 690 | 1015 | YES | 1199 | YES |
| Biology | 675 | 474 | PROBABLY | 542 | POSSIBLY |
| Mathematics | 2000 | 2169 | YES | 2495 | YES |
| Design & Technology | 620 | 481 | YES | 562 | YES |
| Art & Design | 605 | 527 | YES | 601 | YES |
| Geography | 685 | 407 | POSSIBLY | 455 | NO |
| Classics | 75 | 40 | NO | 43 | NO |
| English | 1980 | 1418 | PROBABLY | 1586 | POSSIBLY |
| Drama | 370 | 253 | PROBABLY | 283 | PROBABLY |
| Business Studies | 1200 | 270 | NO | 301 | NO |
| Music | 260 | 192 | POSSIBLY | 215 | PROBABLY |
| Religious Education | 450 | 269 | POSSIBLY | 308 | NO |
| Others | 2035 | 418 | NO | 456 | NO |
| History | 520 | 872 | YES | 974 | YES |
| Modern Languages | 1085 | 1107 | YES | 1214 | YES |
| Physics | 810 | 1342 | YES | 1466 | YES |
| Physical Education | 655 | 1298 | YES | 1405 | YES |
| Computing | 565 | 686 | YES | 794 | YES |
Based upon ‘offer’ recorded in the June update from the DfE, and with just three more reports to come before courses commence, I have made four downgrades and one upgrade to my expected outcomes for the current recruitment round.
I have downgraded expected outcomes for, biology, geography, English and Religious Education, including reducing Religious Education to a ‘No’. however, I am aware that there is a vigorous advertising campaign currently underway by the Religious Education sector, reminiscent of the RETRI initiative led by Dr John Gay a quarter of a century ago. Success in attracting new applicants could mean that it would be possible to hit the target for Religious Education. I do wonder why more subject groups don’t invest in advertising the benefits of becoming a teacher.
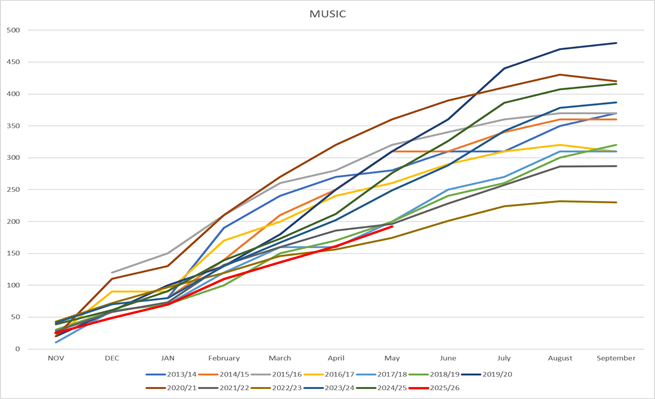
If science graduates discover there is space for those with some biology, then that subject might reach its target. Music looks likely to meet the target, but that target, in my opinion, has been set far too low to meet demand from schools, especially with the DfE’s latest initiative on extra-curricular activities for all, including within the scope, music. It will be difficult to achieve success in music without more teachers. However, meeting the low target will justify the removal of the bursary for music ITT.
Applications from outside of the United Kingdom represented 25% of all applications this June compared with 18% in the data for June 2025. If all non-Uk applicants had applied for secondary sector courses, then they would currently account for more than a third of applicants across all subjects, compared with a quarter in June 2025.
More evidence of the lack of interest in teaching from hone-based students comes from the fact that the number of graduates in the age group ’21 and under’ applying for courses is only 115 higher this June at 3,685 compared with an increase in applications of nearly 2,000 from the ’30 to 34’ age grouping.
The increasing interest in teaching from men continues, with applications up from 16,796 in June 2025 to 21,774 this June! It would be useful to know more about where this increase is focussed, and what the implications might be for the sector.
As ever, the DfE continues not to share ethnicity data with the sector. With so many overseas applicants at present, is that a helpful omission from the dataset?
Higher Education continues to bear the brut of the increase in applications, with ‘partner led’ and ‘salaried’ routes static, and only a small increase in applications to SCITT courses. However, PG teaching apprenticeships have seen a healthy increase in applications from 6,328 to 10, 493. However, offers are little changed at 1,066, compared with 966 in June 2025.
Perhaps because of the arrival of the postgraduate apprenticeship route, offers for the ‘salaried route was only 266 this June, compared with 518 in June 2025. Mr Gove’s brave new world of 15 years ago now looks like a distant dream, as higher education continues to take the bulk of applications, proving the resilience of the sector in the face of determined onslaughts during the coalition government to remove its dominance from the training of new graduate teachers.
With the end of the school term rapidly approaching, the next three months traditionally see relatively few new offers: will this year be any different, especially given the press comments about graduates unable to find work, or does teaching still look like an unattractive carer to debt strapped UK graduates?
With falling rolls affecting job prospects after training and the acquisition of more student debt, and a possible below inflation pay settlement, the signs for increased interest in teaching as a career during the rest of the recruitment round are not good.