London schools and challenging pupils: better outcomes than elsewhere?

Yesterday, I wrote a blog post about the rate of exclusions and suspensions from schools in London and the other regions of England of pupils eligible for Free School Meals as a part of a series about whether better funded schools were able to keep more of their pupils in schools. As promised in that post, I have also looked at the position with regard to the main ethnic, groups and a few of the less considered sub-grouping. Are London schools overfunded? | John Howson

As the following table shows, the picture for London is much more mixed with respect to the different ethnic groupings than for pupils eligible for Free School Meals.
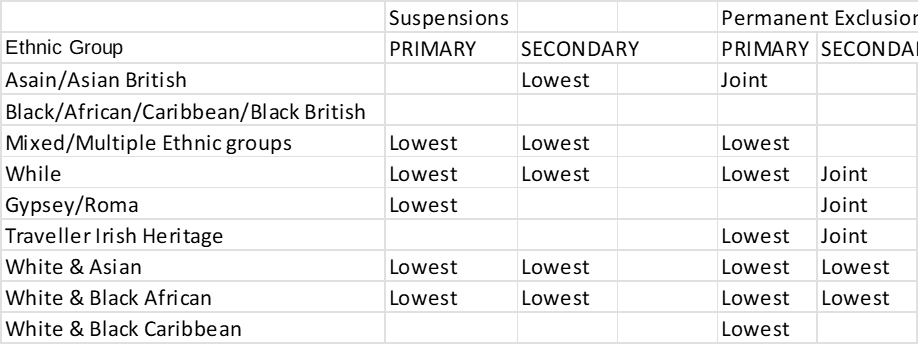
London had the lowest rate of suspensions for five ethnic groups in the primary school sector, and four in the secondary school sector.

In respect of permanent exclusions, where rates are generally very low, and a single exclusion can affect the rate significantly, London had the lowest rate in six of the nine ethnic groups for the primary school sector and was joint equal in a seventh group. In the secondary school sector, London had the lowest rate in only two categories, but was joint lowest in another three groups- mostly were there were no permanent exclusions in this group in a number of regions, including London.

The position in special schools was somewhat different, as shown in the table.
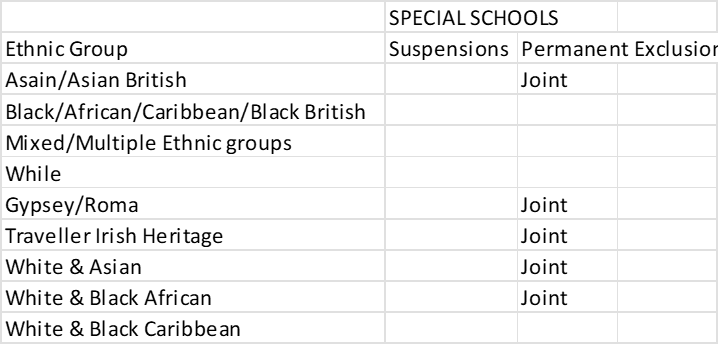
London was not the lowest region in any ethnic grouping in ‘suspensions’ in the special school sector, and was only joint lowest in ‘permanent exclusions’. In most cases there were no permanent exclusions in these groups in any of the regions listed as ‘joint’ lowest, including in the London region. As pupils may attend some special schools from different local authorities to that where they live, and the funding for such schools is not through the  ‘School Block’ but was through the discredited ‘High Needs Block’, it is difficult to read anything into the results for the special school sector, except to say that no other region has the same level of outcome as the London region.

London schools contain a much more ethnically diverse group of pupils than schools in some other of the English regions, notably the North East and South West regions. Despite this fact, or possible because the familiarity of dealing with pupils from a wide range of different ethnic groups, often in the same classroom, and sometimes having come to school in England from war-tern or other challenging environments, have meant policies are in place to deal with situations that were less common outside the capital’s schools, London as a region still outperformed any other region in terms of being in lowest place of any region either on its own or in joint lowest position.

One can wonder: is this due to the funding being better than elsewhere? The funding formula school prevent that outcome for primary and secondary schools, if not for special schools. However, as I asked in the previous post in this series, is it the fact that funding includes a London allowance important, as the extra cash may go further if London schools employ younger, and thus cheaper teachers than in some other parts of England.

Do London schools use their cash for more classroom assistants and other staff likely to help reduce the level of suspensions and exclusions?

The data is intriguing, and worthy of more analysis than I have time to undertake. Are there also lesson to be learnt from London schools about how to reduce the number of pupils ‘kicked out’ of schools?

Finally, do academies or maintained schools exclude or suspend more pupils in different groups of pupils? What role, if any, do local authorities still play in helping keep down the levels of suspensions and exclusions? Time for me to go search the research literature.

Falling rolls: Are school closures inevitable?

The past month has seen a number of posts on this blog about falling school rolls, and what the impact of pupil-led funding formula might mean for schools.  Now that the DfE has published the data around admissions to schools for September 2026 and the 2026/27 school-year, it is possible to look at the latest trends. Primary and secondary school applications and offers: 2026 – GOV.UK

Thanks for the doctrine of parental choice, pupils may attend a school in a borough other than the one where they actually live, but most primary age pupils will probably attend their nearest school. Exceptions are around faith schools, where the nearest school may be in an adjacent borough. This is more of an issue for the secondary sector than for the primary school sector.

Although Inner London boroughs do feature more amongst the boroughs with the largest decline in applications between 2019/20 and 2026/27 school-years, although four London outer London boroughs are to be found in the top ten boroughs with the largest percentage decline in applications. These four include three boroughs in South London.

Despite the presence of Kingston upon Thames and Richmond upon Thames near the top of the table, boroughs on the outer edge of the capital are more likely to be found towards the foot of the table, with smaller falls in the number of applications over the time period.

It is easy to see from this data why primary schools across London are closing or amalgamating. Indeed, the pressure for further rationalisation of the school estate across the capital is likely to be intense in the next few years. How that pressure is handled will determine the careers of many staff, both teaching and non-teaching, and the fate of pupils.

I wrote a play to demonstrate some of the issue facing staff and parents list year – see (1) Post | Feed | LinkedIn if you are interested.

One of the features of the play is that not all schools are facing the same degree of hardship from falling rolls. To follow up on this point, I looked at two measures for pupil numbers and school capacity primary schools – including separate infant and junior schools – in one outer London borough.

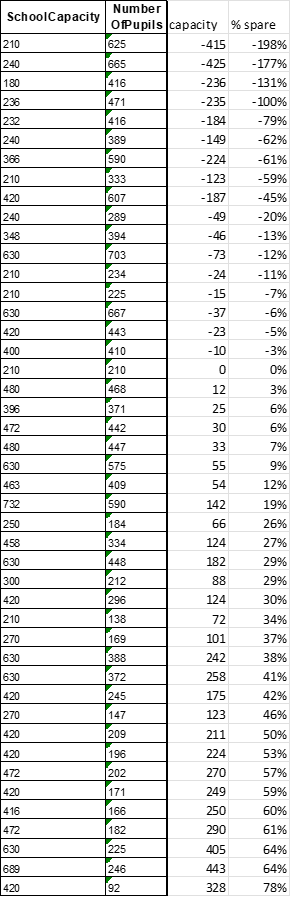
The DfE website information on schools for the borough shows five schools where the roll exceeds the school capacity. However, a more detailed look at capacity and numbers using a different part of the DfE website reveals a more widespread issue in the borough.

I wonder whether the basic information on capacity is actually the capacity based upon the admission number policy and the other on the actual building capacity?

The table for the second indicator reads as below

The data might suggest that some schools are educating children in temporary buildings, assuming the DfE’s data on capacity are up to date. However, if the numbers are correct, then nearly half the schools already have significant spare capacity, and the situation may only become worse.

The key question for both local and national politicians arising from this data, if it is correct, are, ‘Do we let the market solve the problem of falling rolls or do we intervene and manage the capacity in a manner that is best suited to numbers over the next decade?’

Those historians of education that have studied policy decisions will know what happened in the 1970s and early 1980s, a period when there was the last large-scale downturn in pupil numbers. How officers and politicians in Haringey tried to tackle the issue in the late 1970s is an interesting and cautionary tale.

Can we make savings in our school system?

We all know that government finances are tight, and with both defence and the NHS on the lookout for more cash to spend, the Labour government has a challenging time ahead if it doesn’t want to raise taxes. Welfare reform is a big issue, but the increase in the number of pensioners, and especially older pensioners, together with an increasing number of young NEETs provides a real challenge for any government when allocating priorities for the taxes it can raise.

Before looking at three possible areas for savings in the school system, here is a suggestion for attacking the NEET problem. Every school should offer one apprenticeship for every 25 pupils. Smaller schools should be encouraged, but not required to take on at last one apprentice.

This scheme might create perhaps 20,000 new jobs that offered real work to those currently unemployed. I would have paid for the scheme both by unused Apprenticeship Ley cash returned to the Treasury, and by using the dormant assets funds for this much more defined scheme than for the recently announced ‘Every Child Can’ programme that seems a good intention but won’t necessarily reduce the number of NEETs.

Now for my ideas about efficiency savings. There are three areas where I think a national strategy could reap dividends:

Small Sixth Forms

Small Schools

MATs numbers and costs

Earlier this year, I wrote a post on this blog about small sixth forms, and their results. This was based upon an analysis of ‘A’ Level results for one year in one local authority area, where all secondary schools are academies. Are small sixth forms a good idea? | John Howson

Wit the prospect of a period of falling rolls, a national strategy for post-16 education might be unpopular with schools and teachers, but might pay dividends in reducing expenditure in this sector.

Falling school rolls also offers the opportunity to take another look at small schools.  I know that overheads have been brought down by creating executive heads for several schools, and allowing primary schools to open nursery classes, but could a strategic look at the school estate provide significant savings? Of course, such an approach would bring the government into direct conflict with both the Church of England and the Roman Catholic Church.

The third saving would be achieved by doing away with the dual system of local authority and academy schools, and returning to a single system of governance for schooling. I would prefer a school system with local democracy at its heart, but even an NHS style MAT managed system ought to capable of saving lots of cash compared with the present shambles.

I looked up a series of MAT accounts for 2024-25 in one authority area and estimated spending of nearly £28 million on a range of services.

000s of £sSpend
2158LEGAL
446ACCOUNTANCY
64PROF FEES
1569INSURANCE
1021GOVERNANCE
2211RAISING FUNDS
5196OTHER SUPPORT COSTS
14241OTHER COSTS
932EDUCATION CONSULTANCY

As the DfE already has the data, they will know how much could be saved just on governance if there were no more than five MATs in each local authority, and legal and accountancy services were purchased from the public sector. Completely rationalising the governance of the school sector should save a nit insignificant amount of cash.

Sadly, I think there is little chance of any significant savings under the present government.

Falling rolls in London: much worse than the rest of England

In my last post on this blog, I looked at the worsening of primary PTRs across much of the DfE’s ‘Inner London’ area. Falling Rolls: Is the funding formula making matters worse? | John Howson

This post looks how ‘Inner London boroughs have fare compared with the rest of England over those three years?

I think it is fair to say that London as a whole really has seen a significant downturn in primary pupil numbers. There are 22 local authorities where primary pupil numbers as published by the DfE have reduced by 5% or more between 2023/24 and 2025/26. Of these, 13 are London boroughs, and six – seven if Newham is included – are Inner London boroughs.

Seven of the top 10 places for the largest percentage decline in primary pupil numbers are filled by London boroughs. The other three places are taken by the Isle of Wight, Rutland and Torbay, three of the smallest unitary authorities in England.

Birmingham, Manchester and Leicester are the only large cities in the table. They fill three of the four bottom places for local authorities with a decline in pupil numbers of five per cent or more, along with Hillingdon in West London.

At the other end of the table, there are few London boroughs with less than a two per cent decline in their primary pupil populations.


London boroughs at this end of the table seem to be mostly outer London boroughs on the fringe of the metropolitan area. By contrast, there are seven county councils in the list of lowest declines in pupil numbers. This number increases to eight, if the Staffordshire figure, of an increase in pupil numbers, is correct.

The London boroughs will have the numbers in reception for each year, and will know how much worse the decline is likely to become over the next few years. More school closures look inevitable unless the funding model is changed to protect schools with declining rolls.

Not to protect the school estate in London is to assume that there will never be an upturn in pupil numbers. In cities, closing schools and selling off the site for housing means that in any upturn land may not be available for any new schools needed for the extra pupils. This is where thinking for the longer-term is important. During the last downturn of this size, most schools in London remained open, although some, such as Stamford Hill Infant and Junior School in Haringey, where I attended in the 1950s, did eventually close. Interestingly, the one form entry St Anne’s Church of England Primary School, close to Stamford Hill School that wasn’t actually in Stamford Hill, is still open.

However, this is not the post to discuss whether or not, in a more secular society, faith run schools should be closed where an alternative non-faith school can absorb the pupils. But this is an issue to debate, especially in urban areas.

In villages, the church-run school may still be the only school available, and that raises a much larger question about who should run state funded schooling? As the Wesleyan Methodists put it when faced by the 1902 Act, and decisions on whether to open state-funded secondary schools; are our teachers, teachers of children or teachers of Methodist children?

Falling Rolls: Is the funding formula making matters worse?

There has been a lot of discussion recently about falling school rolls in the primary school sector in London. This discussion led me to wonder whether a funding formula that is heavily weighted to a per pupil funding model might mean schools with falling rolls would have to adapt to a decrease in their income.

One possible outcome of less funding could be a worsening of pupil teacher ratios if individual support for pupils with SEND is cut, and also whole classes are amalgamated. My thesis is that Inner London boroughs might be witnessing the worst of the falling rolls problem, partly because they are boroughs with little room for new housing to be built, but also because inner cities have traditionally been the home of new arrivals to a country. Post Brexit, many European families from countries such as Poland and Romania may also have chosen to return home, taking their children with them.

With the release last week of the school workforce data for 2025/26, by the DfE, it is possible to review the pupil teacher ratios (PTRs) for each borough for the three-year period from 2023/24 to 2025/26.

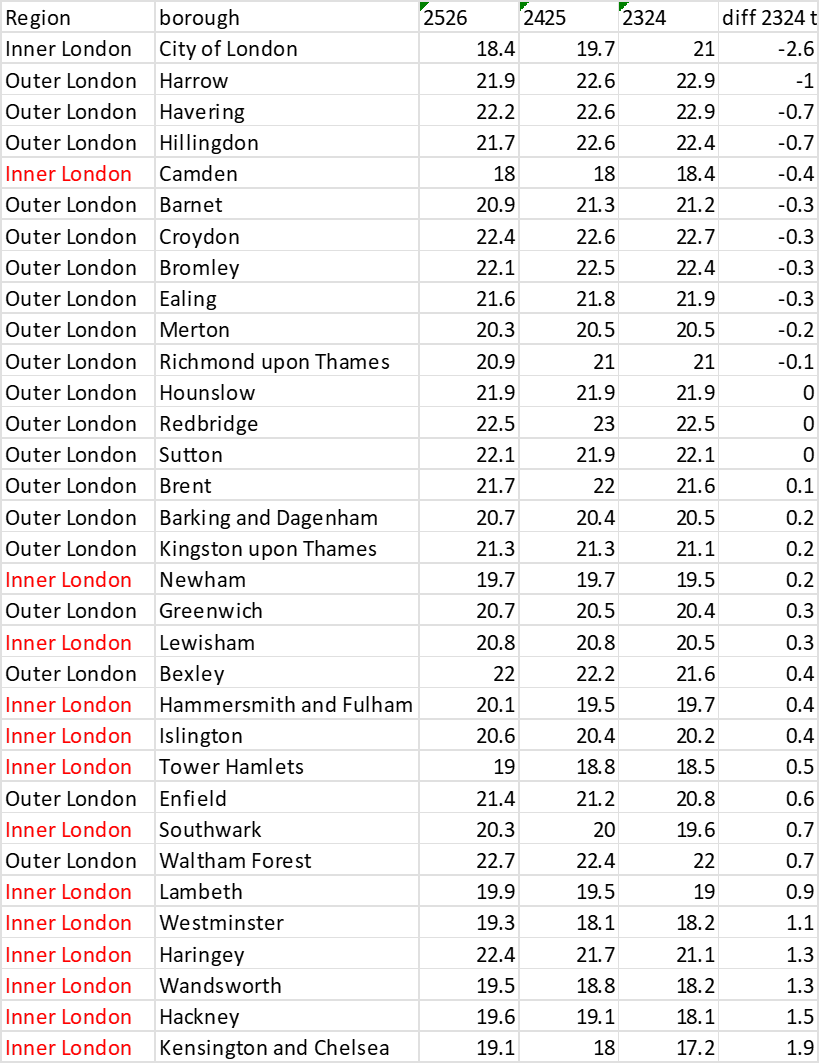
Of the boroughs in London, including the City of London, 11 boroughs improved their primary PTRs between 2023/24 and 2025/26. All but one, Camden, were Outer London boroughs. All the other Inner London boroughs recorded a worsening of their primary PTRS over the three- year period.

In the case of Kensington and Chelesea, albeit a small borough, the change was from 17.2 to 19.1 pupils per teacher over the three years: a decline of some 10%. This is a relatively large change for such a short period of time.

Seven Outer London boroughs also recorded a worsening of their primary PTRs over the same period. Of these boroughs, two, Newham and Greenwich have been classified as Inner London boroughs at sometime in the past.

Apart from the City of London, the boroughs with most improved PTRs are on the edge of London – Harrow, Havering, Hillingdon, Barnet, Croydon and Bromley.

The data in the table does suggest that falling rolls have been accompanied by a worsening of PTRs. Might this be caused in part by the construction of the National Funding formula that is heavily weighted towards a per pupil element? Reduced funding is certainly likely to impact upon class sizes and the use of teachers with small groups. Increasing class sizes and cutting individual teacher support for vulnerable learners is likely to impact upon a school’s PTR. If the reduction in pupil number sis widespread across a borough, then the impact will be seen in the PTRS for all primary schools in the borough.

I think that there is a case to be made that falling rolls are worsening PTRs for the remaining pupils across much of Inner London.

For a longer-term analysis of PTRS in London, and how over time they have been better than in most of England see  (1) (PDF) PTRS OVER TIME: A REVIEW OF PUPIL TEACHER RATIOS BETWEEN 1974 AND 2024 AND TWO PERIODS OF LOCAL GOVERNMENT RE-ORGANISATION PTRS OVER TIME: A REVIEW OF PUPIL TEACHER RATIOS

School Transport- who pays for diesel’s price increases?

Since the start of the conflict in the Middle East, the price of diesel at the pumps has increased from around £1.42 – the average price before the conflict – to £1.90 at the start of May What is happening to UK fuel and petrol prices? – BBC News By comparison, at the height of the concerns over the Ukraine conflict, the price of diesel peaked at just under £2 per litre.

So, could the pump price charged for diesel fuel in 2026 go even higher than the price witnessed in 2022? As I write this, on the 3rd May 2026, it seems quite possible, and even probably that this will be the case: hopefully, I am proved wrong.

The increase in the price of fuel, the rise in the minimum wage, and other cost pressures due to inflation still being above the Bank of England’s target figure of 2%, will be bad news for those local authorities with significant transport bill for conveying pupils to and from schools, either for SEND or because their pupils live in rural areas beyond the two or three mile distance, historically seen as the distance where it is reasonable for parents to pay to ensure children attend their nearest school.  

Although fuel costs are not as high a proportion of total transport costs as are wages, an increase of a third in fuel prices is going to have an impact on transport contracts being negotiated for the new school year starting in September 2026.

A council with a £40 million education transport bill, not unreasonable for a large rural shire county, might see a 5-10% extra charge. This translated to £2-4 million extra across a council’s financial year, and likely even more across a school-year if prices continue to rise further.

 The risk is that some operators might well collapse under the price increase, especially if they are in fixed price contracts with a local authority, leaving a seller’s market, as operators will know that pupils must be transported to school.  Could this outcome drive prices even higher?

How will local authorities cope with these prices increases? Those with reserves, will draw on them until the next round of council tax rate setting in February 2027. However, many local authorities don’t have large reserves, and with local government reorganisation looming for the rural areas, running up a deficit may not be possible.

What remains is either cuts to other services or a government bailout to cover the extra cost of fuel. With social care, and adult social care especially, taking the lion’s share of the budgets of rural counties, there may be few services where cuts are possible, especially since adult social care can involve its own significant fuel costs associated with ‘care in the community’.  

Protecting services such as the youth service and the funding for under-fives could be at risk if local authorities have to bear the brunt of transport related cost increases, especially since the war started just at the wrong time for local government financing, when budgets for 2026-27 were already finalised.

With so many different political parties now in charge, it will be interesting to see how they approach this problem, and who is asked to take the consequences.

Falling rolls -who dictates the outcomes for schools: Parents or planners?

How do you deal with the issue of falling rolls in our schools? A senior politician recently told me that there was no way they would reduce the admission number for a successful school, because the parents wouldn’t stand for it.

Interestingly when Mrs Thatcher widened the concept of parental choice in section 6 of the 1980 Education Act, the civil servants left a ‘get out’ clause allowing local authorities to override their ‘duty to meet the expressed parental preference’ because it was ‘prejudicial to the efficient use of resources’.  Back in those days, the notion of parental power was very much in its early days.

Now the politician I spoke with was only voicing the approach any retailer might take to falling sales; cut out the loss-making branches and strengthen those that make a profit. ‘Let the weakest go to the wall’, a dictum many learnt in school when studying their Skaespeare.

But, should public services operate in the same fashion? It’s worth remembering that parents are required to educate their children, and the State is the default provision for those that don’t, won’t or in most cases cannot do so in any other way.

How the State has responded to that demand from parents for schooling has changed over time. A reader reminded me of the Liberal Democrat position, as expressed by Nick Clegg during the coalition government that perhaps took parent power to the ultimate. I wrote then a blog post entitled Private education, but State Funded? | John Howson This might have been a good idea at the start of a decade of rising school rolls, but does it hold good when rolls are falling?

I guess it depends upon where you live. In a densely packed urban area, with many schools within easy distance of each other, survival of the fittest might seem logical even if the fittest was a Church School and didn’t have many pupils on free School Meals.  However, even in urban areas, change is rarely easy, and often messy, and the current funding formula for schools doesn’t help.

Schools below capacity often run at a deficit, so should academy trusts prop these schools up with cash from other schools that don’t spend all their income?  Perhaps that’s why parent power – or at least parent governors – don’t exist in most academies, in case they rumbled what was happening.

In less urban areas, the issue is more complex. Consider the following case study. Imagine a town and its locality with 5 primary schools where there is little or no house building, and post-covid relatively little movement in the housing market. The current position for one such town

is shown in the table below.

In total, the five schools had 857 pupils on roll, but with a capacity for 1141, so were operating at 75% capacity. Intake for the latest year was lower at 66% of capacity.

 TYPECURRENT ROLLCAPACITY% CAPACITYPlaces offered – latest
SCHOOL 1RC1182105613/30
SCHOOL 2CofE2993159545/45
SCHOOL 3COMMUNITY1782108516/30
SCHOOL 4ACADEMY1301966615/30
SCHOOL 5COMMUNITY1322106318/28

Schools 1-3 are in the town, and schools 4-5 are within easy travelling distance. The obvious answer might be to close one of schools 4-5, but that would create additional transport costs for the local authority; to be paid from Council Tax.

Closing the RC school is not possible, as the exiting pupils cannot be accommodated at the other two schools, as they have insufficient spare capacity, and the need would be for an additional 70 places over the current capacity. Should the RC school numbers fall further to less than 100-110, and intakes not increase at the other two town schools, it would be possible to close the RC school if each of the other two schools in the town could take an extra class. However, the restricted nature of their sites may that possibility unlikely.

What happens if the RC school remains open, and starts to run a deficit budget and, as a consequence, either the diocese eventually decided to turn the school into an academy or it is judged inadequate by ofsted, and forced to become an academy. Could the diocese transfer funds from other schools to keep the school open?

What of the future for schools 4 & 5 if they are faced with the same scenario of starting to operate on deficit budgets, and the risk to the local authority with regard to school 5 at a time of great pressure on the authority’s budget.

Should someone create a plan for the future. If so, who? The local authority, the Regional School Director, the DfE? Or does the desire of the parents for one particular school eventually affect the other four schools, and the market decides? Discuss.

For those that want to consider the issue further, I wrote a play around a school facing falling rolls in its locality to try to tease out some of the issues. You can access it at C:\Users\dataf\OneDrive\Documents\FallingRollsPlay.docx or by requesting a copy by using the comment section

Reader might also like this post from a decade ago. My concern about the future of small schools isn’t new. Are small schools doomed? | John Howson

Demand for SEND places

Yesterday, I wrote about the forecast decline in primary and secondary school places. In the past, less attention has been paid to the need for places for pupils with SEND. However, possibly as a result of the rapid growth in EHCPs, and hence the demand for specialist provision, the DfE has started trying to forecast what it has termed ‘the Local authority pupil forecasts for ‘Local authority specialist provision for pupils’.

This exercise was always going to be something of a challenge since it is taking place against falling pupil numbers, especially in the primary sector, but increasing demand for EHCPs. However, if demand for EHCPs continues to increase, it won’t necessarily mean a demand for more special school places, because some of the increased demand is likely to be met by specialist provision within schools as ‘specialist bases’ are created, often using the spare capacity arising from falling rolls.

At present the DfE data shows that the current stock of special schools is operating at over-capacity by some 10,000 places. At the top of a demographic cycle, such pressure would not be surprising, as schools often take ‘bulge’ classes for a couple of years using temporary buildings rather than built new schools that might not be needed as rolls fall. Whether that is the correct approach in the present circumstances for the special school sector is unclear from the DfE’s data published yesterday. School capacity in England: academic year 2024 to 2025 – GOV.UK

An analysis of local authority data around provision of specialist provision for the period up to the end of the decade reveals large differences across the country in projected need. At one end of the spectrum, three local authorities are projecting grow of in excess of 1,200 places each in the primary sector. At the other end of the spectrum, twenty-four authorities are predicting a reduction in need, with one ‘Reform’ led county predicating a need for 500 fewer places. Interestingly, the adjacent unitary authority is predicting an increase of over 100 places.

Oxfordshire, whose primary and secondary place forecasts were discussed in my previous post is predicting only a very small increase in the number of primary places.

These significant differences don’t seem to be related to either the underlying pupil population or the trend in pupil numbers in the primary sector. This raises issues about how reliable the current forecasting around the demand for SEND places is for policy-makers. Accurate data are important, because of the cost of provision in the SEND sector.

Data on provision of places are also important in helping identify workforce needs. It seems odd that the DfE doesn’t seem to have a unit that brings together trends in pupil numbers and the demand for both places and people to educate the projected school population.

If the DfE did have such a unit then it might look at the costs of small sixth forms and of central overheads by different MATs. It might also look at the issue of small primary schools, and how they might be protected in rural areas, but possibly amalgamated in urban areas. Is a one-from of entry school viable in London?

Hopefully, the data published yesterday will create some debate around the important, but often overlooked, issue of pupil place planning, and the future shape of schooling in the modern age.

White Paper: bad news for rural primary schools

Tomorrow, Monday, we will see Labour’s White Paper in full. For now, we have copious leaks and SEND and other matters, such as how to tackle the outcome gaps between the most deprived pupils and their more fortunate fellows either sitting alongside them or in other schools to whet our appetite.

The replacement of Free School Meals as a measure of deprivation has been long overdue, but it will be interesting see, as schooling moves from a local service to a national service, administered in a similar fashion to the NHS, whether the civil service will be any better than local politicians at managing the performance of the school system.

Making all schools academies will be the final nail in local government’s interest in schooling. Once SEND is handled nationally, it will just leave admissions, mainly on-line these days, to be removed from local management.

However, the changes already foreshadowed in the leaks mean that there will be winners and losers. Assuming that H M Treasury might fund some of the SEND changes, there is unlikely to be any new money to support schools to improve.

The present Funding Formula is heavily biased towards pupil numbers. Great when rolls are rising, but bad news for small schools when rolls fall. If the formula is altered to move more money towards schools with significant numbers of pupils not achieving expected standards, where will the cash come from?

Might small rural primary schools with good attendance and excellent results see their funding cut in real terms? If so, what are the consequences likely to be?  Trusts will be reluctant to keep schools that cost more to run than they bring in through funding open, and will have no incentive to do so. Afterall, any travel costs will be paid for from the local authority under present arrangements.

I can see the local government organisations saying that if local authorities don’t run schools, then they shouldn’t have to pay any transport costs. Taking £46 million off Oxfordshire County Council’s budget would pay for an awful lot of pothole repairs, not to mention bolstering other services.

For those local authorities currently receiving little funding from central government, removing schooling entirely from local government would be an unexpected bonus. On the other hand, there would, as with the NHS, be no local democratic accountability. Education rarely features during general elections.  

One bonus of a national school system is that the government might feel able to create a universal system for secondary schools, some 61 years after Circular 10/65 and on the 50th Anniversary of the 1976 Education Act.

Without democratic oversigh,t ignoring the 2006 rules about closing small rural primary schools will be much easier. Small one form entry faith schools in urban areas with good results have even less protection. It is worth studying the results for primary schools in Haringey to see the parts of the borough that might be winners and those that might be losers if funding doesn’t increase overall.

As someone that started teaching in Tottenham in 1971, when we had ‘areas of exceptional difficulty’ payments introduced into ‘Education Priority Areas’ it is interesting to see how stark the divide between schools on opposite sides of the railway line north from Kings Cross still remains.

So, will the government close that divide? But will it be at a cost to rural primary schools in Oxfordshire, my current home?

Brand names for schools?

What’s in a name? I suspect that St Mary’s, albeit in a myriad of different forms, probably remains the most popular name for a school; certainly, for primary schools.  For some reason, it seems like it is less common to use the name of a saint in the name of a church secondary school. The exception to this rule seems to be where the saint was a Martyr, and especially and English martyr.

However, with the growth of academies, is a new trend developing of including the name of the operator of the Multi Academy Trust to which the school belongs in the schools’ name? I was alerted to this possibility when entering headteacher vacancies. Recruiting headteachers in 2025 – a mixed picture | John Howson

In the course of entering vacancies, I came across a school called: ‘Saracens Broadfields’. Now, I have always associated The Saracens with a rugby union club, originating, I believe, in Southgate. This school provides no indication of its location in its name, but it is located elsewhere in outer London.

Some MATs, such as Dixons, provide both the brand name, Dixons, plus the location in the name of the school in the names of many of their schools.

Of course, it is important to know the group responsible for a school, and in the days before websites, when parents had to rely upon the noticeboard by the school gate, that noticeboard used to display the local authority, diocese or other operator of the school alongside the school’s name. In practice, most schools still have noticeboards, and these boards still contain the same information. However, it is often more of a challenge to find who is responsible for a school from its website.

Happily, the DfE has a solution, as the details of a school on the DfE information portal contain the name of any academy trust, diocese, local authority or other operator. This makes it possible to see all the schools under the control of the operator; very helpful where the schools are spread across several different local authority areas, as is the case with many dioceses, and a growing number of academy trusts.

Apart from Queen Elizabeth, and various Henry’s, royalty does feature highly in school names. These are usually references to Tudor monarchs that help establish the schools from with the current school can trace its lineage.  A few politicians, often former education ministers, such as Ellen Wilkinson and Rab Butler have been honoured to have schools named after them. Some other famous people have had local schools named after them, such as Sir Malcolm Sarget in Stamford and Sir Frank Whittle in Coventry. Florence Nightingale has a primary school named after her, and Elizabeth Garrett Anderson has a secondary school bearing her name, although from its web site it would be a challenge to discover why the school had that name, and that seems a shame.

So will schools be unceasingly likely to display their brand in their names. If so, what will happen when a school is traded between MATS for some reason or other.  Clearly, the name will have to change.

Let me finish this post, the first of 2026, by wishing readers all the best for the New Year. May 2026 be a good year for you.