Last week, the DfE published the latest report from the School Teachers Review body (STRB) School Teachers’ Review Body – THIRTY-SIXTH REPORT – 2026 This is the 36th Report from this body. Its recommendations on pay were accepted by the Secretary of State.
While the headline increases in pay, in percentage terms, seem generous, in reality they are part of a catching up exercise of a similar type to that which caused the hard-fought battle with resident doctors in the NHS.
Here’s what the STRB said about teachers’ pay over the past decade and a half:
• The real-terms value of median teacher earnings has fallen since the early 2010s. The fall in real teacher pay has been greater than that for other professional occupations.
• When comparing teachers’ pay to that of other professional occupations by age and region using data from the SWC and the ONS, teachers fell below the comparators in all groups. The gaps between median teacher pay and that of other professionals was greatest in London.
• Based on proprietary benchmarking data, starting pay for teachers is between the lowest quartile and median for roles of comparable size and scope.
These three comments seem to justify the pay rise, and it is not a generous settlement in a vibrant labour market for graduates. If that market cools between now and 2027, possibly because of the effects of AI on entry level jobs, it will be interesting to see what the next STRB pay report suggests.
The STRB summed up the situation in the most recent period as follows:
In 2024-25, for the Rest of England and London, teachers’ median earnings were below those of the comparator groups for all age bands. The gaps between teachers’ earnings and those of the comparator group were greatest in London.
Across most age categories, the relative earnings of teachers deteriorated from 2014-15 to 2019-20, both in the Rest of England and London. After a slight improvement in 2020-21 during the COVID-19 pandemic, this downward trend for relative earnings continued across all age categories to 2023-24. Over the latest period, between 2023-24 and 2024-25, the relative earnings of teachers have slightly improved, although their median earnings remain below other professional occupation counterparts.
Overall, teachers aged 21 to 30 compared least favourably against the other professional occupations, both in the Rest of England and in London. Those in the oldest age group (over 60) compared most favourably, although are still behind relative earnings of those in other professional occupations. Page 70
In summery the STRB concluded that;
Our analysis of real-terms pay changes over time suggests that the competitiveness of teachers’ earnings compared to the whole economy, wider public sector and to professional occupations, was lower in 2024/25 compared to 2010/11. Figure B.10 shows how the real-terms value of teachers’ median earnings fell throughout the early 2010s. The chart shows there was some improvement for teachers between 2018/19 and 2020/21, prior to the pay pause in 2021/22, and a period of decline to 2023/24. There was some improvement in 2024/25, however we estimate that teachers’ median gross earnings in 2024/25 were 13.9% below their level in 2010/11 in real terms. Median gross earnings for the whole economy were 0.6% below their 2010/11 level, whilst median gross earnings for professional occupations were 9.2% below their 2010/11 level, in real terms. Page 71
One issue potentially facing the STRB could be the problem of a single pay scale for all teachers when the labour markets for primary and secondary school teachers are operating in very different ways. However, it would be a brave government that tackled this issue. Most likely, a move on allowances, and how they are offered, could be the obvious way to tackle over-supply in the primary school labour market, and areas of shortage in the secondary school teacher labour market.
The STRB had something to say about the axing of bursaries from some ITT subjects.
111. The number of bursaries available for 2026/27 has been reduced across a range of subjects, with others seeing a reduction in the bursary value. The bursary values for Biology and Geography are both down by 21,000, while Modern Foreign Languages and Design Technology are down by 6,000. Art, Music and Religious Education are down by 10,000 to zero, with English down by 5,000 to zero. We also note that for Business Studies, Music, Religious Education, Modern Foreign Languages and Design Technology, the reduction in bursary value coincides with the failure to reach target entrant numbers in 2025/26. P101 My emphasis
There is also an interesting table (B21) that provides evidence to support my posts over the past year querying why music and also Religious Education lost their bursaries. Pages 100 to 102, and especially table B21, where music and Religious Education were placed in the top three subjects for the lowest percentages of ITT placed filled, provide cogent evidence for the need for an explanation as to how bursaries are allocated to different subjects?
I think the STRB are sending a coded message to the DfE in this report about the lack of bursaries in some of the subjects that struggle most to recruit. The DfE’s answer, backed by HM Treasury, would no doubt be that there are few graduates in these subjects to entice into teaching, so the bursary would be paid to those already choosing teaching as a career. Funny how that argument doesn’t work for physics or mathematics.
A couple of other interesting nuggets for the STRB report:
• In 2024/25, male teachers had higher earnings overall than female teachers across all school types. Median earnings were higher in secondary schools than in primary and nursery schools.
• Based on proprietary benchmarking data, starting pay for teachers is between the lowest quartile and median for roles of comparable size and scope. …. The comparative basic salary position of leadership roles in primary schools is generally below the market base salary data, whilst roles in secondary schools are better aligned to the market base salary data.
• The full-time equivalent (FTE) teacher workforce decreased by 0.1% or 432 between 2023 and 2024. Secondary schools once again saw the largest absolute increase in teacher numbers.
• The proportion of teachers from an ethnic minority background remained stable, with 89% of teachers across state-funded schools being white. The proportion of white teachers is higher in nursery and primary schools than in secondary schools and increases with seniority in leadership roles.
Finally, a word about leadership pay. The STRB concluded that:
2.25 The comparative salary position of leadership roles in primary schools falls below the market salary data in all regions, whilst leadership roles in secondary schools are better aligned to the market salary data. P11
After a year of tracking headteacher vacancies, I do wonder why anyone would take on a job both teaching and leading a small primary school for a salary of little more than £60,000 from September when a classroom teacher with no responsibilities, and a similar length of service could be earning nearly £53,000.
Little more than £10,000 extra, for both the loss of the 1,265 working time protection and all the extra responsibilities, seems like a gross imbalance in differentials. This is especially the case when all primary leaders, and not just headteachers, work on average 5.1 hours more than classroom teachers. Table B14 page 91.
I will say more about the issue of headteachers’ pay when I publish my review of headteacher vacancies for 2025-26 at the end of August.
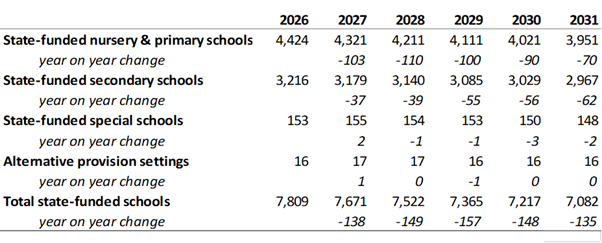
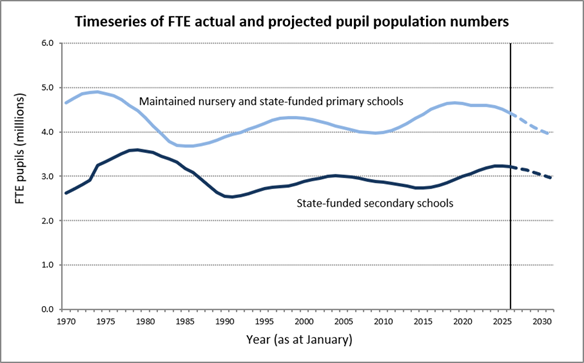
The saviour for the government when considering future pay is ‘falling pupil numbers’. This issue makes the need to recruit teachers, especially with the current age distribution of those teachers in employment less of an overall challenge.
However, as indicated earlier in this post, dealing with the consequences of different primary, secondary and further education labour markets may be a real issue for the next STRB Report.