For most of my adult life, the government department responsible for the supply of teachers, whether it was called the DfE, DES, DfEE or by another name, has used a version of the Teacher Supply Model to calculate future teacher needs, and presumably to ensure the government doesn’t waste money training too many teachers.
Training too few teachers, not as a result of the Model, but because of under-recruitment into training, has been a problem for the Teacher Supply Model (TSM) during periods of teacher shortage. Do you either add the under-recruitment to the TSM target in any one year to the next year’s TSM total, thus making it even harder to reach, or do you accept every school starts each new school year in September fully staffed, so there are no vacancies to be filled, even if additional trainees just happened to be recruited. Over the past forty years, both approaches have been tried: neither really works.
I first came across the TSM in the late 1980s when, in response to a Select Committee Report, a technical document explaining the working of the TSM at that time was published. Between the late 1980s, and a seminal announcement, also to a Select committee, by David Laws when he was the Minister of State that the TSM would be part of open government, the TSM remained largely secret, apart from one other document published in the late 1980s in repose to yet another two Select Committee reports.
Why were successive government keen to keep the TSM under wraps? Possibly because the workings allowed for an understanding of future government policy. There are three obvious areas where changes in policy can have consequences for schools and society that might create political debate: reactions to future pupil numbers, whether up or down; changes in education funding that might allow more or less funds for schools; policy changes such as extending the learning leaving age or the introduction of a new subject, such as citizenship or computing. All impact on the TSM
Governments often don’t want to signal policy changes ahead of time, especially if they might be controversial. In the first decade of this century, the secrecy around the TSM almost caught out the ITT sector when falling rolls together with improved ITT recruitment made a reduction in ITT numbers inevitable for secondary subjects, especially as there was no policy around improving staffing levels in the secondary sector, partly because of the decision over the introduction of non-contact time in the primary sector.
Planning is an essential too of any organisation, including governments, whatever extreme free-market thinkers may say. After years of following the consequences of the TSM decisions on the outcomes for the teacher labour market, I have some concerns about what happens when the TSM has been run for any particular year. The elements of the TSM have changed over the years, as explained above in relation to under-recruitment as an example. That’s not an issue for me, although the discussions with the sector may have helped prevent some changes to the TSM in mor recent times.
What is at the core of my concerns about the TSM is the length of time between the collection of the data for input into the TSM and the consequences for the real-time labour market for any September recruitment round, let alone the needs for teachers to fill any January vacancies.
I acknowledge that improved and faster data collection over time thanks to better computing capabilities has helped reduce the time taken between data collection and the effect on the labour market of the TSM output for any recruitment round. Currently, data from the 2025 School Workforce Survey, collected in November 2025, will probably influence the TSM run for the 2027 entry into training, and hence, the 2028 labour market.
At least with most trainees now on a one-year postgraduate training route, there is no longer the issue of a four-year undergraduate course to add into the mix. The November 2025 data collected, if such courses were still a significant part of the ITT scene, would not affect the labour market until 2031. A lot can happen in the intervening years.
Even with the shorter training period, there is still a time lag between data collection and the consequences of that data on the labour market.
My question is, should a further check be added once the TSM has been used to calculate ITT targets, in order to allow the comparison between the TSM target and the current reality of the labour market?
The DfE now has excellent data from several years of operating its own vacancy platform, and there are also private operators monitoring the labour market with useful vacancy data in real time. This data can be compared with the TSM output target to allow a discussion about the validity of the TSM target to current labour market needs.
Now, it may well be that the TSM number is the best fit for training needs, but as my previous post that considered the labour market data for teachers of music alongside the ITT target cut that presumably emerged from the TSM output has suggested, the addition of vacancy data does allow for a debate about whether the TSM target under or over estimates demand. Music ITT: has the government made a mistake? | John Howson
Such use of vacancy data also allows for a consideration of policy changes, such as how schools react to a change in a market where QTS still allows any teacher to teach any subject to any child, and ‘permits the use of unqualified staff. where nobody with QTS is either available or considered sufficiently expert at delivering the curriculum.
The TSM isn’t outdated, just, in my opinion, no longer enough by itself to ensure an orderly labour market for teachers.
Why is this important, it is because the market does play a part in determining how shortages are dealt with. Where are the qualified teachers of physics teaching? How much more do schools with high levels of free school meals have to spend on recruitment than a school with fewer such pupils? Important questions around the staffing of the nation’s schools.
I read the Fed report on education issued yesterday National Education Report 2026 – FED and believe that the supply of teachers and school leaders is still at the heart of any effective system of education.
How any government determines teacher supply is a vital decision affecting the lives of many young people. Ensuring every child has the best possible teachers throughout their whole school-life is equally as important as whether or not they are banned from social media, but much less often discussed.
I think that teacher supply issues should be much higher up the education agenda, but I would, wouldn’t I, having spent a career worrying about teacher supply matters.
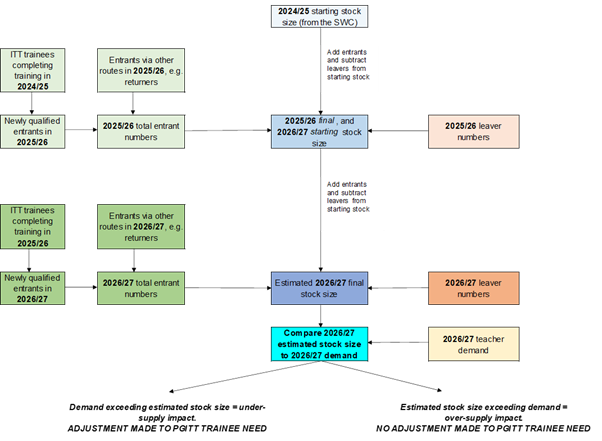
The Model can be easily described in the DfE’s own diagram
It is interesting to note that the Teacher Supply Model
assumes that as pupil numbers grow, teacher demand will grow too, and vice versa. Additionally, the model assumes that PTRs will grow in line with the historical relationship between pupil numbers and PTRs. Similarly, the model assumes that PTRs will fall if pupil numbers fall. In other words, as pupil numbers grow, the TWM assumes that schools will increase the size of the teacher workforce and allow class sizes to grow a little.
As a result, the Model finds it challenging to manage changes, such as in the curriculum. One of the best examples was the introduction of citizenship during the Blair/Brown Labour government. Schools didn’t sack teachers to make space for teachers trained in the subject, and with no historical data to underpin the need, estimates had to be made.
The assumptions about pupil teacher ratios are, of course, unable to factor in economic headwinds that might change assumptions about future funding of schools. There was a god example early in this century when, in a budget, the Chancellor announced extra cash to be sent directly to schools. Not surprisingly, the schools went after extra teachers and equilibrium in the labour market was only restored by a hike in teachers’ pay that dampened down demand that had not been anticipated in the Modelling.
I have discussed these points with the overseas governments that I have advised on teacher supply modelling over the years. I also favour including a check on what is currently happening in the labour market by surveys of vacancies. Advances in technology, such as pioneered by TeachVac, way back in 2013, allow current trends to be matched with the data input into the Teacher Supply Model that may be two to three years between data collection and the output of trainees based upon the data joining the labour market.
One increasingly interesting issue that the Teacher Supply Model may need to consider is the growing international labour market for teachers. The Model currently imperfectly accounts for loss from the trainee and existing teacher pools to the private sector in England. In the future, it might need to consider how many trainees opt to work abroad. This will be especially important if more overseas students are offered places on teacher preparation courses. Will they be offered visas to teacher in England, or will they leave the country after completion of their courses? I will try to consider this issue in a later post.
Finally, I am delighted that the statisticians have abandoned what they have called ‘the removal of the need for an adjustment relating to forecasted under-supply’. Adding back in the number of unfilled places from a previous ITT round to the next year’s total was never a good idea, as I have made clear in a number of my posts on this blog. The decline in Physics ITT places from a high of 2,250 in 2024/25 to just 810 for 2026/27 is a good case in point.
However, has this re-assessment of need gone too far? Based on Timo Hanney’s work on vacancies and my own current research into vacancies for teachers of music, I think the DfE has been realistic in its approach. After all, if they have under-estimated demand, the government can always recruit more teachers from overseas by enticing those trained here to return to England.
Earlier this autumn I was asked to prepare a lecture for Oxford Brookes University. Sadly, it was never presented for a variety of reasons. So, for any reader of this blog that would like a longer than normal post to read over the holiday period, I have published the text of the lecture below.
Best wishes for the holiday season to all my readers and thank you for the continued support of this blog.
Brookes Autumn Talk 2022
Teacher Supply in Oxfordshire – does the market model work?
Thank you for once again inviting me to talk to you about my special subject: the labour market for teachers. Last time, I started with history, this time I thought I might concentrate on geography. More specifically, the geography of Oxfordshire, its schools and their need for teachers and school leaders to staff them and what implications this might have for policy makers, were they willing to listen.
First, a bit of background. As many of you know, the government has always had a key role to play in managing the supply of teachers to schools through its grip on the teacher preparation market.
The DfE’s Teacher Supply Model tries to predict how many teachers need to be trained each year in order to ensure a sufficient supply of new teachers to provide staffing for schools across England. The Model is a national model, and does not consider regional differences.
Another drawback of the DfE’s Teacher Supply Model is that it doesn’t consider the backgrounds of entrants to ITT. Are they undergraduate; recent graduates; career changers or teachers from overseas requiring QTS to be fully accredited to teach in England?
Some of you may recall the Carter Review and its look at ITT. In my submission to that Group, I made the point that now all those considering teaching were from the same backgrounds or stages in their careers:
So, consider these individuals thinking about teaching as a career: (Blog 23rd June 2014)
Jane is a recent graduate, age 22, with an upper second degree in modern history. Since GCSE she has studied no history pre-1472. She wants to teach history in a secondary school.
Kevin is a 28-year-old policeman who is looking to change careers to work with young people in a positive way. He has a lower second-class degree in forensic science, and wonders what he might teach in the secondary sector
Helen is a 35-yearold mum with two school-age children. She has a degree in physics, and since the birth of her own children she has volunteered a day a week at a local primary school. She is interested in teaching children at Key Stage 1.
Wayne is studying for his ‘A’ levels in media studies, photography and theatre studies. He is 20 and had a chequered history as a teenager, but now wants to become a teacher and put something back into society.
Of the four all have different needs, and some are better served by the present routes than others.
Jane would have the option to select from the two School Direct routes, (assuming that the Salaried route is still operational) a higher education course, a SCITT course or Teach First. As history is a popular subject, attracting more applicants than places, she might be told by some course providers to acquire some experience of schools in a voluntary capacity before being considered. If she applied after Christmas for courses starting in September, she would probably find her options severely limited. In most cases she would find herself having to pay another set of tuition fees to study unless she was lucky enough to be accepted on either the Teach First programme or to find a School Direct salaried place.
Kevin has a degree that doesn’t fit a National Curriculum subject, so would either need to find a means of enhancing his subject knowledge or find a provider that felt he had enough science to be accepted onto a course. However, since the government split the sciences into the separate subjects of Physics, Chemistry, and Biology, the general science courses that might have accepted him have largely disappeared.
His work experience might count in his favour, especially if he had worked with young people, but his chances might depend upon when he applied. If he applied early in a recruitment round, he might fare badly as providers might expect more suitable candidates with better subject knowledge would apply later in the recruitment round.
However, if, later in the round, applications were sluggish, he might fare better, especially if he interviewed well. He would not be eligible for Teach First, but would receive some financial support if he trains to teach a physical science subject. However, he would be looking at a sizeable reduction in pay for at least a year while training even if he found a School Direct salaried place.
Helen wants to teach children at the younger end of the primary school. Although Helen has a Physics degree that isn’t likely by itself to put her near the front of the queue because currently there is no requirement for providers of primary training to consider recruiting a balance of candidates with different subject backgrounds.
Assuming Helen has the basic GCSE qualifications required much may depend upon what point in the recruitment cycle Helen applies and her three choices of provider.
Although she may not have studied any arts or humanities subjects for more than half her lifetime that probably won’t matter. She will receive basic training during her course. The time she has spent as a volunteer may help her be accepted if the head provides a good reference.
Wayne has selected ‘A’ levels that limit his chances of becoming a secondary school teacher because there are few training places to teach drama, media studies or photography, even if he achieves the required degree with a minimum of a lower second.
He could consider becoming a primary school teacher, and either enrols on an undergraduate degree leading to QTS or takes a subject degree and then competes with other graduates for one of the places, perhaps on an Apprenticeship.
He would be well advised to undertake some youth work either as a part of his degree course or as a voluntary activity as this might strengthen his chance of being accepted. It is unlikely that he would have a degree in a subject acceptable to Teach First, and there is a strong chance that he would have to pay fees and take out a loan to support his living costs through his training.
As the range of degrees available at universities becomes ever more diverse, so the link between the higher education experience and the needs of schools in terms of curriculum delivery becomes ever more decoupled. This may not seem to matter for much of the primary sector, where direct curriculum knowledge may not be required, but even at that level a need to understand the fundamentals of a subject may be important in both teaching it well and also in helping other teachers to deliver the subject as well.
Nationally, the recruitment campaigns are generic and don’t focus on any particular groups in society. Should they take these different motivations into account and should the DfE consider these issues when deciding upon the operation of the Teacher Supply Model?
I might add that the DfE has thought about issues around race, gender and disability in terms of teacher recruitment ever since 1997.
Summary of final year postgraduate trainee outcomes for the 2020/21 academic year
Percentage awarded QTS
Percentage of those awarded QTS teaching in a state school
Age
Under 25
90
72
25 and Over
86
73
Disability
Declared
81
68
None declared
88
73
Ethnic group
Asian
81
64
Black
78
65
Mixed ethnicity
86
72
Other
82
66
White
89
74
Gender
Male
84
71
Female
89
73
Source DfE
I find this table deeply disturbing in many ways, but we don’t have time today to do more than note that to belong to a minority group seems to be a challenge when finding a teaching post in a state school.
Anyway, after that digression, back to our main thesis about the labour market for teachers and the working of the Teacher Supply Model.
After taking into account flows out of teaching to other careers; to retirement or other non-work situations, such as a career break; or in a small number of cases death, the Model looks at the number of possible returners and those switching from part-time to full-time or in the other direction.
Trends in pupil numbers also need to be factored into the Model along with any possible policy changes affecting teacher numbers, such as when the Key Stage 1 maximum class size policy was introduced by David Blunkett. These days, such policy changes are rare. More challenging to predict is how schools will use their budgets, and the modelling process largely ignores this variable when considering teacher numbers and how they will change. This is an interesting area for debate, especially at the present time when schools are more financially challenged than for many years.
Because policy changes often cannot be predicted., especially as with the Key Stage 1 maximum class size rule the policy often comes after a change of government. The Teacher Supply Model must inevitably be forward looking, and even if there is no change of government, Ministers are often unwilling to flag policy changes too far in advance for party political reasons.
The Teacher Supply Model currently being discussed by the DfE will apply to the number of teacher preparation places in 2023/24 and will not impact upon the labour market for teachers until September 2024.
Because the Model is a national Model, and is created by statisticians, its role is to provide overall numbers for the primary sector and numbers by selected subjects for the secondary sector.
Herein lies another issue. What constitutes a subject? For any years, Science was a subject, as Modern Languages still is. The Model created a total for science teachers needed. The science community argued for many years that there was a need for separate totals for Biology, Chemistry and Physics with an apparent lack of concern for any other ‘science’ subject. Eventually, the DfE agreed and total for each science were created.
The unintended consequence of this move was to limit the number of biologists recruited into teaching and thus to reduce the overall number of science teachers in training. We only have to look back at Kevin with his forensic science degree to debate the wisdom of a lack of any ‘general science’ route into teaching. This is one for the science community from the Royal Society outwards to re-visit.
I think that is quite enough background on the Teacher Supply Model. Let’s now move to the real world from the abstract discussions, important though they are, about overall numbers.
Of course, if those numbers, whether called allocations, targets or by some other name, are not met then schools may find recruiting teachers more of a challenge.
Whose responsibility is it to meet that challenge?
The government
Higher education
Schools?
Without a coherent strategy to either avoid or deal with any shortfall of teachers, it will be pupils that eventually feel the consequences though curriculum change, larger groups or being taught by less than adequately equipped teachers in terms of the teacher’s knowledge and backgrounds regardless of whether they teach early years or KS5 physics.
The government can gain relief when pupil numbers reduce, usually following a sustained fall in the birth rate, as we have seen recently after the big increases of more than a decade ago.
Chart of pupil demography
Relief may also come from more returners than normal and fewer departures from the profession whether for career breaks or to other forms of employment.
For the purpose of illustration during the rest of this talk I will be concentrating upon the secondary sector. This is partly because there are fewer issues in the classroom teacher market for the primary sector, although I acknowledge that following the recent re-accreditation exercise the future is opaquer than it has been in the past.
Before looking at the current position in terms of recruitment in Oxfordshire across the secondary sector during 2022 it is worth noting that the national ITT position for this year based upon the comparison of trainee numbers with classroom teacher vacancies for a range of secondary school subjects.
Subject
1/1/22 – 30/9/2022
History
44%
PE
23%
Art
12%
Geography
-157%
Languages
-108%
English
-57%
All Sciences
-84%
RE
-108%
Mathematics
-45%
Music
-96%
Computer Studies + IT
-137%
D&T
-583%
Business Studies
-313%
The chart is created by matching the number of trainees in the DfE ITT census for 2021-22 with the number of vacancies recorded by TeachVac during the 2022 calendar year starting at 1st January. The chart records the position in terms of the remaining ITT pool at Friday 30th September. The remaining pool is arrived at by reducing the ITT number by one trainee for every two vacancies since the DfE data suggests that around a half of classroom teacher vacancies each year are filled from the trainee pool.
Negative numbers indicate more vacancies than there were trainees. There are, of course, issues with the methodology, since vacancies that are re-advertisements may legitimately be included, but repeat advertisement should not be taken into account.
Only in history, PE and art were there still positive numbers at the end of September and art is likely to turn negative before all the January 2023 vacancies are filled.
To put the data into context. Here was the ITT Census data from last December.
2013/14
2019/2020
2020/21
2021/22
Percentage of Target at census date
%
%
%
%
Mathematics
86
65
84
95
English
136
110
127
118
Modern Languages
85
64
74
71
Biology
163
189
117
Physics
42
45
22
Chemistry
67
80
105
Physical Education
138
105
135
164
Other
57
82
25
Design & Technology
45
42
75
23
History
150
115
175
199
Geography
100
118
130
86
Computing
63
75
105
69
Art & Design
136
62
132
140
Religious Education
82
94
128
99
Music
97
80
125
72
Drama
157
Business Studies
88
53
102
45
2021 ITT Census – DfE
Looking at both primary and secondary total the following picture emerges
2013/14
2019/2020
2020/21
2021/22
All Secondary
98
83
106
82
Inc TF
Inc TF
Inc TF
Primary
99
94
130
136
Inc TF
Inc TF
Inc TF
What is noticeable, is the effect of the covid pandemic on recruitment into teaching as a career. There was a significant bounce in interest about teaching as a career after the pandemic struck in March 2020 that saw an increase in applications to train as a teacher. However, it was short-lived and did not continue into the recruitment round for courses that stated in the autumn of 2021 for the secondary sector, although trainee numbers remained above target in the primary sector.
It is worth recalling that there was talk of significant failures in the economy, and teaching always attracts more applicants when the economy and the wider labour market is faring badly.
So, now let’s look at Oxfordshire and the local labour market for teachers before finally considering the relationship between local demand and supply of new teachers into the labour market.
Frist, the primary sector. This table is for vacancies for classroom teachers with No TLR attached. Basically, an entry level grade
Oxfordshire Classroom teacher vacancies January to September 2022
CLASSROOM TEACHER – NO TLR
INDEPENDENT
STATE
TOTAL
% INDEPENDENT SECTOR
PRIMARY
32
348
380
8%
I am surprised how low the percentage is, so, what about the secondary sector? For ease of comparison, TeachVac groups subjects together into a number of larger units. This partly because the range of titles used by schools when recruiting is so vast that it is unhelpful for the purpose of analysis to use the whole range when they can be reduced to a smaller number of composite groupings.
SECONDARY SCHOOL CLASSROOM TEACHER VACANCIES NO TLRS
SUBJECT GROUPS OXFORDSHIRE
Independent
State
TOTAL JANUARY TO END SEPTEMBER 2022
% INDEPENDENT SECTOR
BUSINESS STUDIES
42
9
51
82%
SEN
12
8
20
60%
SOCIAL STUDIES
35
35
70
50%
LANGUAGES
23
25
48
48%
ART
9
10
19
47%
ENGLISH
44
56
100
44%
IT/COMPUTING
21
27
48
44%
MATHEMATICS
52
76
128
41%
SCIENCE
79
116
195
41%
DANCE
7
11
18
39%
PE
11
21
32
34%
HISTORY
9
20
29
31%
GEOGRAPHY
10
25
35
29%
HUMANITIES
4
11
15
27%
MUSIC
4
18
22
18%
VOCATIONAL
1
5
6
17%
RE
3
23
26
12%
D&T
4
63
67
6%
Grand Total
370
559
929
40%
On average, across Oxfordshire, the independent sector was responsible for 40% of the vacancies for classroom teachers advertised during the first nine months of 2022. The percentages range from 82% of basic grade vacancies in business studies, to just 6% of vacancies in Design and technology. Interestingly, the independent sector percentage for Business studies reduces to 71% if you add in posts with TLRs.
The list of schools advertising for business studies is interesting
School
Independent
State
Total
Cranford House School Trust Limited
8
8
d’Overbroeck’s
4
4
Faringdon Community College
1
1
Kings Education (Oxford)
7
7
Lord Williams’s School
2
2
Magdalen College School
1
1
Matthew Arnold School
1
1
Oxford International College
3
3
Oxford Sixth Form College
6
6
Shiplake College
7
7
St Clare’s, Oxford
1
1
The Bicester School
2
2
The Oratory School
5
5
The Oxford Academy
1
1
The Warriner School
1
1
Wheatley Park School
1
1
Grand Total
42
9
51
This is for Main Grade posts. Add in TLRs and the picture changes slightly.
School
Independent
State
Total
Aureus School
3
3
Cranford House School Trust Limited
8
8
d’Overbroeck’s
6
6
Faringdon Community College
1
1
King Alfred’s
3
3
Kingham Hill School
2
2
Kings Education (Oxford)
7
7
Lord Williams’s School
2
2
Magdalen College School
1
1
Matthew Arnold School
1
1
Our Lady’s Abingdon
4
4
Oxford International College
3
3
Oxford Sixth Form College
6
6
Oxford Spires Academy
3
3
Shiplake College
7
7
St Clare’s, Oxford
1
1
St Edward’s School
1
1
The Bicester School
2
2
The Cherwell School
1
1
The Oratory School
6
6
The Oxford Academy
1
1
The Warriner School
1
1
UTC Oxfordshire
2
2
Wheatley Park School
1
1
Grand Total
52
21
73
Maybe the State sector is more alive to market conditions in this subject than some independent schools that have placed multiple advertisements to try to appoint a classroom teacher in this subject.
In passing, it is worth noting that the DfE records 41 state secondary schools in Oxfordshire and 47 schools in the independent sector, although that total does contain both special schools and sixth form colleges as well as schools serving the primary age-group of pupils. Nevertheless, the number of secondary schools in the independent sector in Oxfordshire is not far short of the number of state secondary schools, although the number of pupils is many fewer. However, that number is offset by the extra demand for teachers to staff the smaller classes normally found in the private sector schools.
One feature of the private sector schools in Oxfordshire is the number of boarding schools across the county. Boarding schools are as likely to cater for students from outside the United Kingdom and as such form an important part of the education export market by attracting foreign currency earnings. In additional to the ‘normal’ type of school, there are also tutorial colleges offering specific courses often for ‘A’ level or other pre-higher education programme that will be looking to recruit from the same pool of teachers as well as recruiting other non-teachers, such as graduate students to teach some courses.
So, there are more than 80 schools in Oxfordshire educating pupils of secondary school age, and together they have generated 929 advertisements for classroom teachers between January and the end of September. After allowing for re-advertisements and expectations for the coming three months, it seems likely that across the whole of 2022 there will have been a demand for around 1,000 secondary school classroom teachers in Oxfordshire.
As many of you know, the DfE has recently concluded a re-accreditation process for ITT. All three providers in Oxfordshire were listed by the DfE in the approved list.
The University of Oxford cites the number of places for 2023/24 as c184 on the PGCE in the following subjects
English
geography
history
mathematics
modern languages (French, German, Spanish, Mandarin)
religious education
science (biology, chemistry, physics).
The Oxfordshire Teacher Training Programme, based at the River Learning Trust does not provide data on trainee numbers. They state on their website that:
“We don’t advertise a specific number of places available for most subjects.”
The programme does cover a wider range of secondary school subjects than the University
However, I doubt that they would be able to make up the difference between the Oxford University provision and the demand from schools identified in the table I showed earlier as that might require them to train several hundred students a year.
I do not believe that Oxfordshire is unique in facing a significant deficit between the number of ITT trainees and the demand for teachers from secondary schools, but the scale of the problem may be more significant than in many other parts of the country.
One solution is the growing number of training providers that claim in their publicity, and their titles, to be ‘National’ in their training coverage. One such is the new National Institute of teaching formed, with government approval by a small number of MATs. They say in their publicity that
‘The NIoT is working with a network of Associate Colleges across the country. These successful groups of schools work with a wide variety of communities across the country’
I note that they have no presence in this part of England. However, this ‘nationalisation’ of training into fewer larger providers is a trend that will need watching.
Of course, both the independent sector and state secondary schools in Oxfordshire have the option to employ staff without Qualified Teacher Status. The term ‘teacher’ is not a reserved occupation term like ‘engineer’, ‘solicitor’ or ‘accountant’, so anyone may be called a teacher regardless of their background and qualifications.
Excess demand over supply causes other problems including a high level of spending on recruitment. There is also the issue of whether some schools either because of location or the characteristics of the school find recruitment more challenging than other schools?
There isn’t time today to delved deeply into that question, although I have written on my blog at www.johnohowson.wordpress.com about the issue of the percentage of free school meals pupils in a school and teacher recruitment.
There is no doubt that the high cost of accommodation in Oxfordshire has an effect of recruitment of teaching staff.
Can anything more be achieved to ensure schools, and especially state schools in Oxfordshire are able to recruit sufficient teachers in all subjects?
I doubt we will ever see the days again when local authorities and the Christian churches provided most of the training places for teachers and the then Ministry of Education issued an annual Circular on the number of new teachers each local authority could employ to ensure some degree of fairness at least at that level.
Indeed, it is not clear which organisation can speak on behalf of the needs of schools across the county for a dialogue about the need for sufficient teacher preparation places in Oxfordshire to meet the needs of local schools. Perhaps, the Schools Forum might take on the responsibility? I am also gratified to hear that the DfE Steering group might have a look at ‘cold spots’ in ITT. However, that raises another issue about the availability of school placements and whether those that train as teachers should be expected to work in state-funded schools? The answer to this was clear-cut when trainee’s fees were paid and there was a training grant for all. It is, perhaps, more complex now trainees bear a greater or lesser degree of the costs depending upon their subject or sector.
In conclusion, the failure to train sufficient teachers puts the system under strain. Oxfordshire, with a growing number of secondary schools and nearly as many private schools and tutorial colleges as state-funded secondary schools faces an interesting set of issues in terms of ensuring sufficient appropriately qualified teachers for all its schools.
The modified market model where places are allocated by central government, but schools and trainees compete for vacancies works better for some than others. To return to our four potential teachers, two, Jane and Wayne, can train and teach anywhere, but Kevin and Helen are more closely tied to their local area both for training and for employment. The system hasn’t taken their needs into account and I worry that following the re-accreditation process the needs of candidates have once again not been taken into account.
This lack of an overall policy towards the staffing of our schools as opposed to just predicting training numbers might matter less if sufficient trainees were recruited to fill the places on preparation courses. The fact that there has not been enough to satisfy the predictions of the Teacher Supply Model for several years, across many secondary sector subjects just make smatters worse.
I am conscious that in a university like Brookes, known for training teachers for the primary sector, I have spent most of my talk discussing the secondary school sector. That doesn’t mean that the primary sector isn’t important and monitoring its health is equally as important. However, demand for primary teaching posts at the classroom teachers level remains generally healthy, and the current tissues are mainly in the secondary sector.
I also haven’t had time today to reflect on either middle or senior leadership issues or on the issue of SEND and special school staffing. Perhaps, those could be the topic for another day.
The full list of changes is shown in the table below
subject
number 21/22
number 22/23
difference
Total
31030
32600
1570
Primary
10800
11655
855
Total
20230
20945
715
Modern Languages
1505
2140
635
Design & Technology
1475
1825
350
Computing
840
1145
305
Others
1980
2240
260
Geography
745
945
200
English
1980
2100
120
Physics
2530
2610
80
History
780
850
70
Classics
40
30
-10
Religious Education
470
450
-20
Physical Education
1010
980
-30
Biology
820
780
-40
Drama
330
290
-40
Art & Design
580
530
-50
Music
540
470
-70
Business Studies
725
635
-90
Chemistry
1080
885
-195
Mathematics
2800
2040
-760
Source: DfE
As the DfE noted in their announcement ‘It is also important to note that recruitment to postgraduate ITT in 2022/23 has not been limited for any subject except physical education. Therefore, although targets for certain subjects may have decreased compared to last year, this does not necessarily mean there will be fewer trainees recruited as a consequence – recruitment can exceed targets.’
This statement, of course, raises the question of why have targets? The answer is complicated, and has been a matter for debate for many years. I assume that The Treasury wants some idea of both how the DfE will spent its cash on schemes it operates, and what the drawdown of student loans could be at its maximum. Both are legitimate questions for government to ask. For a number of years, I was part of a group that discussed these targets before they were released, in those days in the autumn as recruitment to the round was about to start. Now, I read them at the same time as everyone else.
The DfE commentary also notes that adjustments have been made for under-recruitment in certain subjects.
‘A key driver of whether the 2022/23 targets have increased/fallen for specific secondary subjects is the extent to which those targets have been adjusted to build in the impact of recruitment being below target in the two previous ITT rounds before 2022/23.
An example of a subject where such an adjustment has been made is modern languages. In the previous two ITT rounds, recruitment for modern languages was below target, so we have increased the 2022/23 target for modern languages to account for this previous under-recruitment. This is the first time we have made such an adjustment for the subject, leading to modern languages having the largest percentage increase in targets this year.
For some subjects, the impact of previous under-recruitment against targets can be offset by other factors. A good example of this is mathematics, where we have seen a decrease in the 2022/23 target compared to last year’s target. Whilst the 2020/21 and 2021/22 PGITT targets for mathematics were not met, the impact of this under-recruitment was more than offset by increases in the numbers of PGITT trainees, returners, and teachers that are new to the state-funded sector being recruited. Furthermore, there was an increase in the proportion of mathematics trainees entering the workforce immediately after ITT.’
This comment from the DfE suggests that retraining courses for serving teachers in subjects such as mathematics might now be considered when calculating targets. It would have been interesting to have seen the worked example for mathematics in order to see which of factors was important in reducing the total to a number close to that for English. Certainly, TeachVac has recorded lower demand for mathematics this year than might have been expected.
Interestingly, in the list of factors affecting the calculation of the targets, the DfE focus on factors affecting inflows. It is not clear the extent to which the changing global marketplace for teachers affects ‘outflows’ and whether any pause due to the effects of covid may have only been a temporary reduction in the number of teachers departing these shores?
The issue of including the effects of under-recruitment in the current targets is an interesting one. Schools start each September fully staffed, so there is a risk that by including the shortfall from previous years in the new target the supply is inflated to a point where a proportion of trainees won’t find a teaching post. It would be interesting to see if these are mostly likely to be trainees with student loans not training through an employer managed route. The DfE will have that data. Inflated targets can also lead to places being provided in parts of the country where there are not jobs. This was a consequence of using this methodology in the 1990s.
At the present time, this consideration of whether to include a previous shortfall in the current target is merely an academic discussion in most subjects, since 2022 will most likely again see courses fail to hit even these revised targets where they have been lowered, except perhaps in Chemistry and possibly mathematics, both subjects where over-recruitment is permitted.
However, the methodology used in calculating targets via the Teacher Supply model (TSM) process may become more important for providers in coming years as pupil numbers stabilise and funding comes under pressure, especially if large salary increases to cop with high inflation are not fully funded by government.
There will be tough times ahead in the ITT world. Will schools want to stay involved and what will be the collective views of Vice Chancellors towards the DfE and ITT?
Those readers that have browsed my recent posts will know that teacher education is facing one of those turning points in its history. Regardless of the policy approaches towards how teachers are prepared there are going to be implications on the sector from the downturn in pupil numbers.
The decline in the birth rate is already being felt in primary schools, with many admitting fewer pupils this September than for some years. Lucky the schools with a new housing estate being built in the catchment area. The DfE has estimated that by 2026 the overall population in the primary sector is projected to be 4,345,000. This is 302,000 lower than the actual figure in 2020 (4,647,000). Such a rapid reduction has serious implications for those that prepare new teachers for the profession.
Taking a teacher to pupil ratio of 1:30 that would mean there would be a need for 10,000 fewer teachers. Now real pupil teacher ratios are much better than that figure, so perhaps the drop might be 4,000 over the period 2020 to 2026. Assuming teacher departure rates don’t alter significantly, and that newly trained teacher are preferred over returners to the classroom, then a drop of 1,000 in training numbers might be an interesting starting point for any discussion.
Of course, the Teacher Supply Model can much more accurately process these changes and identify what the actual requirement for new teachers is likely to be. However, it seems that there will be a reduction in primary training numbers.
The decision must be where and what type of training; school-based or higher education? Course based or salaried? Across all providers or supporting either large or small providers? These are the policy questions that must rapidly be answered. For the longer the delay in reducing training targets, the worse the cut will be if the Teacher Supply Model has really abandoned any idea of smoothing reductions over a number of years and takes any change in the year that they occur.
The latest three year postgraduate numbers for Primary ITT places from the Teacher Supply Model were 12,975 in 2018/19; 13,003 in 2019/2020 and 11,467 in 20201/21. Now, the TSM only covers postgraduate teacher supply. Some providers with both undergraduate and postgraduate provision have, in the past, when there have been reductions in places, kept their undergraduate numbers and reduced postgraduate numbers. The rational for such a move is less based on relative quality of applicants than the fact that undergraduate courses generate more fee revenue than postgraduate courses and are relatively less expensive to deliver. This will be especially true with the latest set of proposals discussed in previous blogs.
Whether the current government will be willing to tolerate any change in quality of applicants due to how providers react to a fall in places available is an interesting policy question that merits some discussion. From the point of view of The Treasury, one-year courses cost the government less in student loans than undergraduate courses, but if those students displaced from undergraduate teacher training courses take other degrees and then a postgraduate teacher qualification, the overall cost can be higher.
By the middle of the decade, the secondary sector will be facing the dilemmas associated with falling pupil numbers, but since recruitment even in regulated subjects such as physical education has been at record levels, enforcing changes there might be even trickier than in the public sector. That is if the present market review hasn’t fundamentally altered the shape of teacher preparation provision in England.
By Monday 17th August some 45,210 people had applied for postgraduate teacher preparation courses through the UCAS Scheme. This was an increase of 6,000 on the number recorded in August 2019, for these courses in England. This represent a 15% year on year increase. However the number is still well below the record levels of more than 60,000 witnessed during the previous recession caused by the banking crisis. No doubt, this is in part due to the fact that it wasn’t until March that the world was turned upon its head.
The 2020/21 recruitment round may well see much high numbers of applicants right from the start of the cycle later this autumn. There are also Teach First numbers to be taken into account, although they don’t publish regular figures on total applicant numbers.
Every region of England witnessed increases in applicant numbers over 2019, with more than 1,000 additional applicants in the South East, and 1,500 in London: good news for both regions. There were also more applicants from all age-groups, as well as from both women and men.
As many of these new applicants have arrived relatively late in the recruitment round, and while schools and universities have been enduring ‘lockdown’, it is, perhaps, not surprising that ‘conditional placed’ numbers are up on last year, whereas, in some cases, ‘placed’ numbers are down.
For instance, for men in the age 21 and under category, there were 340 placed this August compared with 400 in August 2019. However the conditional placed number this year was 760, compared with 530 in August 2019. The number of applicants in this age group increased from 1,300 in August 2019 to 1,450 this August. While four of the seven age-groupings for men recorded fewer placed numbers than last year, only two age groups, the youngest and oldest groupings, for women recorded placed numbers below last year. This may give credence to the suggestion that male applicants for teaching tend to apply later on average than women.
School Direct seems to have suffered this year, with fewer placed applicants for both primary and secondary courses, and quite markedly fewer for School Direct Salaried places. This year only 610 applicants have been recorded as placed against 890 last year. Conditional placed numbers for School Direct Salaried this year are 1,550, compared with 1,710 in August last year. No doubt funding arrangements and school closures have affected this route more than some others.
Some subjects have seen significant increases in the number of applications. Art and design has increased to 3,570 this August compared with 1,890 in August 2019. Business studies, a shortage subject, now has 1,720 applications compared with 770 in 2019. By contrast, geography only has 3,740 applications this year compared with 4,380 last year at this point in time.
Mathematics has seen an increase from 8,600 to 11,000 applications, but only 770 of these are placed and with just 1,750 holding a conditional place it seems less than likely that the Teacher Supply Model number will be reached. The same is true for physics, where applications are up from 2,220 to 2,450, but only 550 are recorded as either placed or conditionally placed: not sufficient to meet the requirement.
So, 2020 looks like being better than recent years, but not yet a great year. Hopefully, the 2020/21 round will see all places filled. Since secondary pupil numbers will still be on the increase, this will be important to ensure adequate staffing for our schools.
The covid-19 pandemic has come too late in the recruitment round to ensure that all teacher preparation courses for graduates in all subjects will recruit enough students for September 2020 in order to ensure enough teachers for September 2021 vacancies.
On the basis of the July data from UCAS, the number of ‘Placed’, ‘Conditionally Placed’ and ‘Holding an Offer’ applications were sufficient in biology; Business Studies; English; history; music; physical education; religious education; art and modern languages to reasonably expect the DfE’s Teacher Supply Number to be reached. The percentage in art and design is the highest number recorded for more than a decade. The primary sector should also exceed its target set by the DfE.
On the other hand, computing and geography might meet the target with a few more acceptable applicants during the summer. However, it seems unlikely that chemistry; design & technology; mathematics and physics will meet the desired number this year. There simply haven’t been enough time to attract applicants, unless that is there is a stream of highly qualified applicants between early July and the start of September.
Interestingly, 24% of applications in physics were in the ‘Placed’, ‘Conditionally Placed’ and ‘Holding an Offer’ categories by mid-July 2020. This was the same percentage as in 2019. The figure for mathematics was also 24% in both July 2019 and July 2020. In Chemistry it had dropped from 25% in 2019, to 23% this year, although there were nearly 600 more applications for providers to process, so the final percentage might be higher.
In music, the percentage in the ‘Placed’, ‘Conditionally Placed’ and ‘Holding an Offer’ categories by mid-July 2020 was 32%, one of the highest for any subject, and up from 26% in July 2019. Physical education, not a shortage subject, has seen their percentage increase from 20% in July 2019 to 24% in July 2020.
So, 2020 looks like being the best year for recruitment into training for teaching for five or six years, but it seems unlikely that all subjects will meet their targets. However, there may well be a glut of both physical education and history teachers entering the market in 2021, unless all the vacancies lost this year by schools either retrenching or not needing to recruit appear again for September 2021.
Would I take on the extra debt to train as either a PE or a history teacher? Well, I would certainly look at the employment record of the course offering me a place this year and check with TeachVac www.teachvac.co.uk what the job situation is like in these subjects, especially in view of any debt to the government that will be incurred by joining the course. After all, we don’t know what might happen to interest rates and repayment terms as the government seeks to manage the economy over the next few years.
Regular readers of this column, and especially those that read my post earlier in the autumn predicating the outcome, will find few surprises in the data. Indeed, most of my conclusions for the 2020 labour market for teachers still stand.
The headline news is that only English; PE; Biology; history and geography recruited more trainees across all platforms than the DfE’s Teacher Supply Model suggested would be required at postgraduate level. Design & Technology; Computing; Religious Education and music all had better years than last year, but still failed to pull in enough trainees to meet likely demand from schools in 2020 as measured by the DfE Model.
Mathematics; Modern Foreign Languages; Physics; Chemistry; Art & Design and Business Studies all recruited a lower percentage of those seen as needed than they achieved last year. English and PE were also in that category, but still pulled in more than 100% of identified need. In both cases, this may cause problems in 2020, especially if the DfE number has been pitched too low, as it almost certainly has in English.
Overall, thanks to the 26% increase in history numbers; the 34% increase in geography – where the DfE number was reduced, but a lack of recruitment controls meant a similar number of trainees was recruited to last year – and Religious Education where there was a surge in trainee numbers this year to a level last seen before 2013, overall secondary trainee numbers increased by 2% to 17,098 from 16,327 last year. That’s 85% of target compared with 83% last year.
As predicted by many providers, recruitment to primary postgraduate courses fell below target at 98%, down from 103% last year. The 12,400 recruited is the second lowest number of recruits for primary postgraduate courses in the past five years. .
Undergraduate numbers continued to fall, with 4,777 primary and just 184 secondary students shown as new entrants. Some 75 of the secondary entrants at undergraduate level are on PE degree courses. The only other subject worthy of note is Mathematics, with 59 undergraduates.
So, what else can we glean from the data? Taken together, primary and secondary postgraduate entrants hit a new low in percentage terms this year when compared to the DfE target; only 89% of target. That’s two per cent down on last year, and is due entirely to the fall in the primary percentage against target.
Men accepted onto primary postgraduate courses hit a new six year low, at just 2,153 compared with 2,415 last year and 2,852 in 2014/15. However, there were more men starting secondary courses, up from 6,285 last year to 6,587 this year, the highest number since before 2014/15. However, it still means that men account for only 17% of primary and 39% of secondary trainees this year.
Minority ethic entrants also reached a new high this year at 19% of postgraduate entrants and broke through the 5,000 level for the first time. Numbers were also up at undergraduate level as well.
Under 25s still account for 50% of new postgraduate entrants, but, as predicted earlier this year, numbers for the 25-29 age group were slightly down on last year. This was compensated for by a rise in the number of those over 45 starting ITT postgraduate courses. The 1%increase in those declaring a disability was also a new record.
Non-UK EEA nationals represented 5% of postgraduate recruitment, the same as in recent years. The percentage for ‘other nationals’ increased to three per cent, while UK national fell to 92% of postgraduate trainee numbers.
There is more to mine from this data, but that will form the basis for another post.
Yesterday, the DfE released the Teacher Supply Model (TSM) information for England covering the academic year 2020 to 2021. https://www.gov.uk/government/statistics/tsm-and-initial-teacher-training-allocations-2020-to-2021 There was also information on the methodology underlying the TSM that continues the trend towards more open government set by David Laws when he was Minister of State at the DfE.
Perhaps one of the strangest lines ever to appear in a government publication can be found on page 3 of yesterday’s key DfE publication, where it states reassuringly for ITT providers that ‘in reducing the 2020/21 TSM target, this does not mean there will necessarily be fewer trainees’. This is because the DfE has continued to uncap ITT recruitment in most secondary subjects, except PE, but has continued to cap primary numbers.
The DfE’s rationale for reducing targets, most of which haven’t been reached in recent years, are improvements in the methodology of the TSM, including the fact that NQTs entering through the assessment only route are now included in the calculations. Put simply, the DfE have found some more teachers not counted in previous versions of the TSM, and that has reduced the requirement for new teachers to be trained in 2020/21.
The problem the DfE civil servants face is that each September schools must be fully staffed, otherwise children would be sent home. This makes it difficult, if not impossible, to carry forward unfilled places from previous years, as there are not vacancies in the system. Also, carrying forward unfilled places would eventually lead to targets that were ludicrous in size. Better to start afresh each year.
Rising pupil numbers, teacher retention rates and curriculum changes are among the key drivers of the targets that are set at a national level. Interestingly, business studies and physics are two subjects where targets have increased for 2020/2021. In the case of the latter, from 1,265 to 1,336, an increase of 71 possible trainees. As in 2018/19 only 575 physics trainees were recorded outside of Teach First, this increase might raise something of a hollow laugh among providers.
One might wonder why recruitment in Biology (reduction of 76 trainee numbers), history (291 fewer trainees) and geography (187 fewer trainees) isn’t capped in view of their over-recruitment in 2018. Could it be that by recruiting in these subjects the overall deficit will be smaller than it would otherwise be? Surely not, but trainees need to consider their job opportunities before undertaking training to become a teachers in some of these subjects. By 2020, the DfE should be able to tell them about job chances as part of the new DfE Apply System that ought to be operating at that time.
Next month, the ITT Census for 2019 will be published, and it will be possible to see whether, as I hope, the shortfall this year is smaller than the number of missing trainees last year.
Overall, the drop of 602 in secondary targets won’t have much effect on the ground. The reduction of more than 1,500 in the primary postgraduate target to just 11,467, may have more implications for some providers and their future, especially if this is not the end of the reductions resulting from the recent decline in the birth-rate.
Schools are going to have to rely upon reducing wastage rates among serving teachers and encouraging returners back into teaching in order to survive the 2020 recruitment round, if the data released by UCAS today about offers for teacher training courses starting this September don’t show dramatic improvements over the next couple of weeks. The DfE is doing a valiant job fast tracking enquiries received by their ‘get into teaching’ site, but so far it isn’t enough to prevent another potential year of problems for schools.
Let’s start with the good news: history has more offers than ever before, and languages; religious education and design and technology have recorded more offers than in August last year. However, design and technology is still way below target numbers needed to meet the Teacher Supply Model number for this year.
Biology, English, geography and physical education are at similar levels to this time last year in terms of recorded ‘offers’ and should produce sufficient teachers to meet needs next year on a national scale, even if there are local shortages because of where training is located. Chemistry is also at a similar level to last year, but that may not be sufficient to meet demand for teachers of the subject.
Now for the bad news: some subjects are recording lower offer levels than at this point in 2018. Business Studies and art, although lower than last year are not at their lowest levels for August during the past six recruitment rounds. However, IT, mathematics, music and physics are recording offer levels that are lower than at any August during the recruitment rounds since 2013/14. Schools across England are likely to experience recruitment challenges in these subjects in 2020 that could be worse than this year unless supply is boosted in other ways.
This grim news, is backed by a depressing 500 fewer placed applicants in England and slightly fewer ‘conditionally placed’ applicants. The additional 30 applicants ‘holding an offer’ do not make up the difference. Overall, some 72% of applicants domiciled in England have been made an offer (73% at August 2018). The published monthly statistics don’t allow for easy comparison by subject for applicants as opposed to applications which, as I have pointed out in the past, is a disappointment.
Nevertheless, most of the reduction in offers is to male applicants, where ‘placed’ applicants are down from 9,250 in August 2018, to 8,800 this August; a reduction of around 450 or the majority of the reduction in offer numbers. It is career switchers that have disappeared, especially those between the age groups of 22-29. The youngest ‘new’ graduate numbers are very similar to last year, but there are more applicants in their 30s than last year.
The School Direct Salaried route continues to be the big loser in terms of offers, but not in terms of applications. Only 770 applications are shown as with offers of any sort compared to 990 last August for the secondary sector. In the primary sector the number is higher at 1,840, but last August the number was higher at 2,000.
There are still very many offers recorded as ‘conditional’ even at this late point in the cycle. Only in history, Mandarin, PE and Religious Education, among the larger subjects, are ‘placed’ numbers shown as higher this August than in August 2019.
Next month will mark the end of the monthly date for this recruitment round. I wish I could say that I was optimistic, but despite the potential turmoil faced by the country over the political situation, I cannot be anything other than concerned for the teacher labour market in 2020 based upon these data.