I don’t often write about higher education, as, although I spent more than a decade running a large department in a university, and also writing about activity-based costings in higher education, I don’t consider myself well enough briefed to comment regularly.
There are exceptions to my self-imposed rule, and this post is one of those. What persuaded me to write this post was a link to this article Universities on the brink: Decoding the UK higher education funding crisis and the path forward | The Educationist
Now, for most of this century, and indeed the last decade of the previous century, higher education providers have been free to operate in a market, with limited government intervention, except in areas such as teacher education, and providing courses for both doctors and the professions allied to medicine.
As I discovered when running courses for new heads of departments in universities about how higher education funding worked, most academics had limited knowledge and often less interest in the subject when asked to take on running department: at that time; even Deans were often more interested in course quality than the financial health of the departments they headed.
Regardless of the reasons behind the current financial malaise, should the market be left to bring the sector back to financial equilibrium? Of course, the government could just throw money at the problem, but I guess it hasn’t the funds, and anyway, the DfE might put NEETs and SEND above bailing out universities in any priority list.
However, I don’t think the government should leave everything to the market. After all, it is the largest consumer of graduates: 30,000 teachers per year to be trained; NHS staff; the defence forces; the civil service and local government. These are all consumers of graduates in large numbers.
Allowing the market to solve the financial problems might have unintended consequences. A major concern for me is around the mobility of new graduates. Many years ago, I studied where trainee teachers went to study, and there was a correlation between where a first degree or higher-level courses was studied, and where individuals entered teacher preparation courses. Universities without schools of education provided fewer recruits to teaching.
Well, Teach First helped solve that problem, at least in London, but I am concerned that market driven course closures could leave parts of the country without degree courses in some subject areas vital for the public sector.
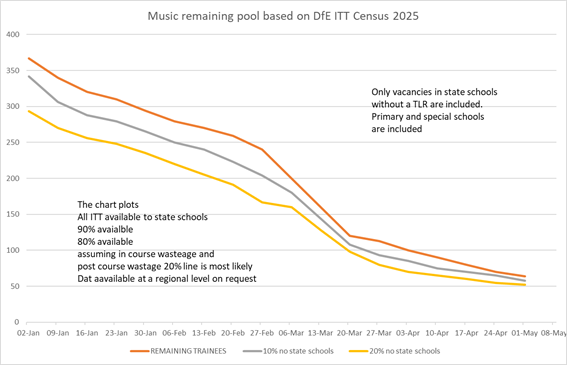
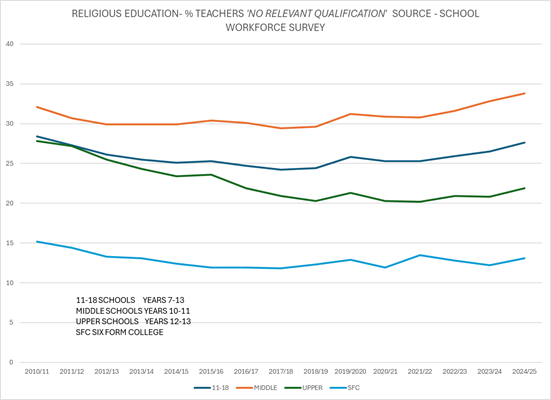
For this reason alone, I think the government should ensure some form of course planning for the higher education sector, so that there are not areas without say, music courses or philosophy. Both are degree courses important as part of the pipeline for future teachers of music and religious education. As these are also both subjects that already fail to recruit enough graduates into teaching, reducing the number studying them on degree courses even further would endanger that pipeline even more.
The intervention of the government in place planning, even at a broad level, also makes economic sense to me, as moving students from loans to welfare is also not a good use of public money. How to manage the balance between leaving the future for higher education to the market, and an orderly return to fiscal rectitude might at least be worth a discussion amongst politicians and those that advise them.