
Yesterday, although a bank holiday in England, more people listed as from the United Kingdom than listed as from the United States viewed this blog. It’s been a while since that has happened.
I guess it was because of the post about the May ITT numbers I posted yesterday. Yesterday also looks like a bank holiday that higher education ignores. I am not surprised as there can be too many bank holidays on Mondays in May, and that fact can play havoc with timetabling.
Anyway, thanks for viewing, as, wherever you are from, your support is much appreciated.
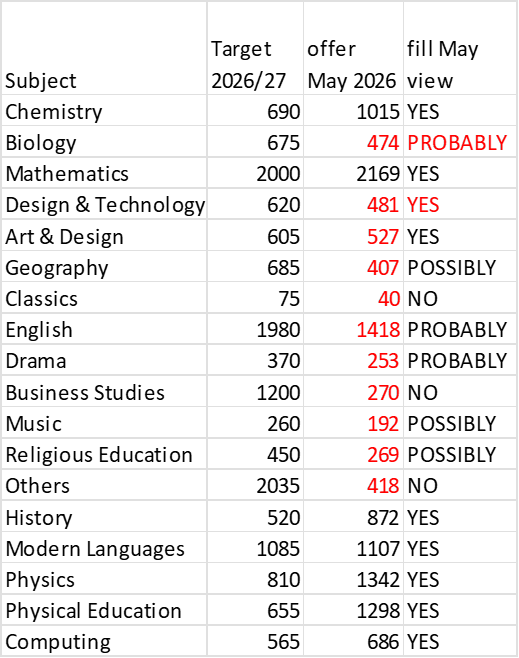
After producing my prediction table in yesterday’s post MayDay for some ITT subjects: joy for others? | John Howson
I thought that I would delve a bit more deeply into possible outcomes. Looking at 2025 data between May and September, and ignoring all applicants not from England, there were 11,773 more candidates in 2024 and 13,387 more candidates recorded in 2025 between May and September.
At 18th May 2026, there were 33,344 candidates, so it seems likely that candidate numbers will be up on the past two years in terms of candidates from England. However, as this also contains candidates for the primary sector, that factor needs to be taken into account. This year, with a low ‘target’ for primary, I would be surprised to see many more candidates applying for primary sector courses, as most courses will presumably be showing as ‘full’.
However, what about the subjects listed as anything other than ‘Yes’ will fill in the previous table? How do they fare?
The following table is based upon ‘offers’ not ‘candidates’ numbers between May and September for 2025.
| subject | May-25 | Sep-25 | difference | % increase offers May to September |
| Others | 418 | 500 | 82 | 20% |
| Classics | 44 | 54 | 10 | 23% |
| Physical Education | 1395 | 1775 | 380 | 27% |
| History | 832 | 1132 | 300 | 36% |
| Physics | 1246 | 1698 | 452 | 36% |
| Mathematics | 2169 | 3142 | 973 | 45% |
| Religious Education | 347 | 508 | 161 | 46% |
| English | 1467 | 2161 | 694 | 47% |
| Drama | 234 | 349 | 115 | 49% |
| Music | 276 | 416 | 140 | 51% |
| Art & Design | 709 | 1086 | 377 | 53% |
| Business Studies | 212 | 329 | 117 | 55% |
| Geography | 731 | 1135 | 404 | 55% |
| Modern Languages | 1089 | 1709 | 620 | 57% |
| Biology | 1094 | 1733 | 639 | 58% |
| Chemistry | 682 | 1091 | 409 | 60% |
| Design & Technology | 466 | 783 | 317 | 68% |
| Computing | 537 | 942 | 405 | 75% |
| Total Secondary | 13530 | 20043 | 6513 | 48% |
There is no doubt that had the DfE output from the Teacher Supply Model remained the same as I 2025, this table might have looked very different.
I think that I might upgrade Geography from ‘possibly’ to probably’ on this data. As music had a bursary last year, I am not yet prepared to upgrade that subject to ‘probably’, at least until after July numbers, and the applications from 2026 graduates have been taken into account. The same is true for Religious Education.
Another area of uncertainty remains around the sciences. The total target had been reached by the end of May, but biology numbers were below target. Will providers top up with students to make courses viable? My guess is, yes, as there seems to be no penalty to the provider for doing so. The risk is all carried by the trainee.
In the future, I think that the DfE needs to consider disaggregating the 2,035 places listed as for ‘other’ subjects. Not to do so makes the data increasingly meaningless, especially once the fact that more than a third of applicants come from outside of England is also taken into account.
Finally, as we know for the annual DfE’s ITT census, not all offers turn into students counted in the census. I might try and look at what level of over-recruitment might be sensible to ensure 100% of the DfE’s target by the time of the ITT census, after allowing for the fact the TSM target should include a percentage of in-course wastage.
Afterall, the aim is to ensure the labour market has the qualified teachers it needs for all students to be taught by properly qualified teachers.


Pingback: Music teachers: labour market update | John Howson