Falling rolls: Are school closures inevitable?

The past month has seen a number of posts on this blog about falling school rolls, and what the impact of pupil-led funding formula might mean for schools.  Now that the DfE has published the data around admissions to schools for September 2026 and the 2026/27 school-year, it is possible to look at the latest trends. Primary and secondary school applications and offers: 2026 – GOV.UK

Thanks for the doctrine of parental choice, pupils may attend a school in a borough other than the one where they actually live, but most primary age pupils will probably attend their nearest school. Exceptions are around faith schools, where the nearest school may be in an adjacent borough. This is more of an issue for the secondary sector than for the primary school sector.

Although Inner London boroughs do feature more amongst the boroughs with the largest decline in applications between 2019/20 and 2026/27 school-years, although four London outer London boroughs are to be found in the top ten boroughs with the largest percentage decline in applications. These four include three boroughs in South London.

Despite the presence of Kingston upon Thames and Richmond upon Thames near the top of the table, boroughs on the outer edge of the capital are more likely to be found towards the foot of the table, with smaller falls in the number of applications over the time period.

It is easy to see from this data why primary schools across London are closing or amalgamating. Indeed, the pressure for further rationalisation of the school estate across the capital is likely to be intense in the next few years. How that pressure is handled will determine the careers of many staff, both teaching and non-teaching, and the fate of pupils.

I wrote a play to demonstrate some of the issue facing staff and parents list year – see (1) Post | Feed | LinkedIn if you are interested.

One of the features of the play is that not all schools are facing the same degree of hardship from falling rolls. To follow up on this point, I looked at two measures for pupil numbers and school capacity primary schools – including separate infant and junior schools – in one outer London borough.

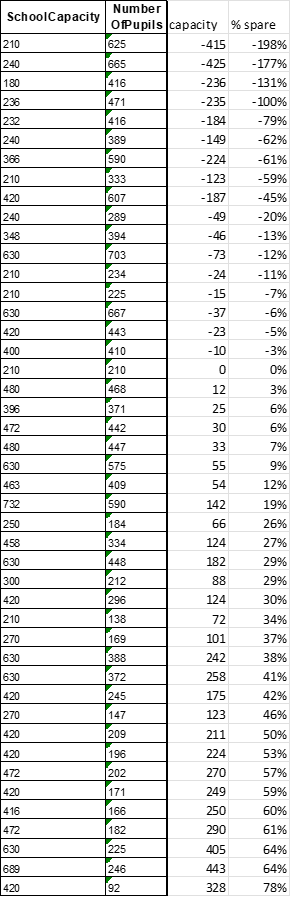
The DfE website information on schools for the borough shows five schools where the roll exceeds the school capacity. However, a more detailed look at capacity and numbers using a different part of the DfE website reveals a more widespread issue in the borough.

I wonder whether the basic information on capacity is actually the capacity based upon the admission number policy and the other on the actual building capacity?

The table for the second indicator reads as below

The data might suggest that some schools are educating children in temporary buildings, assuming the DfE’s data on capacity are up to date. However, if the numbers are correct, then nearly half the schools already have significant spare capacity, and the situation may only become worse.

The key question for both local and national politicians arising from this data, if it is correct, are, ‘Do we let the market solve the problem of falling rolls or do we intervene and manage the capacity in a manner that is best suited to numbers over the next decade?’

Those historians of education that have studied policy decisions will know what happened in the 1970s and early 1980s, a period when there was the last large-scale downturn in pupil numbers. How officers and politicians in Haringey tried to tackle the issue in the late 1970s is an interesting and cautionary tale.

Can we make savings in our school system?

We all know that government finances are tight, and with both defence and the NHS on the lookout for more cash to spend, the Labour government has a challenging time ahead if it doesn’t want to raise taxes. Welfare reform is a big issue, but the increase in the number of pensioners, and especially older pensioners, together with an increasing number of young NEETs provides a real challenge for any government when allocating priorities for the taxes it can raise.

Before looking at three possible areas for savings in the school system, here is a suggestion for attacking the NEET problem. Every school should offer one apprenticeship for every 25 pupils. Smaller schools should be encouraged, but not required to take on at last one apprentice.

This scheme might create perhaps 20,000 new jobs that offered real work to those currently unemployed. I would have paid for the scheme both by unused Apprenticeship Ley cash returned to the Treasury, and by using the dormant assets funds for this much more defined scheme than for the recently announced ‘Every Child Can’ programme that seems a good intention but won’t necessarily reduce the number of NEETs.

Now for my ideas about efficiency savings. There are three areas where I think a national strategy could reap dividends:

Small Sixth Forms

Small Schools

MATs numbers and costs

Earlier this year, I wrote a post on this blog about small sixth forms, and their results. This was based upon an analysis of ‘A’ Level results for one year in one local authority area, where all secondary schools are academies. Are small sixth forms a good idea? | John Howson

Wit the prospect of a period of falling rolls, a national strategy for post-16 education might be unpopular with schools and teachers, but might pay dividends in reducing expenditure in this sector.

Falling school rolls also offers the opportunity to take another look at small schools.  I know that overheads have been brought down by creating executive heads for several schools, and allowing primary schools to open nursery classes, but could a strategic look at the school estate provide significant savings? Of course, such an approach would bring the government into direct conflict with both the Church of England and the Roman Catholic Church.

The third saving would be achieved by doing away with the dual system of local authority and academy schools, and returning to a single system of governance for schooling. I would prefer a school system with local democracy at its heart, but even an NHS style MAT managed system ought to capable of saving lots of cash compared with the present shambles.

I looked up a series of MAT accounts for 2024-25 in one authority area and estimated spending of nearly £28 million on a range of services.

000s of £sSpend
2158LEGAL
446ACCOUNTANCY
64PROF FEES
1569INSURANCE
1021GOVERNANCE
2211RAISING FUNDS
5196OTHER SUPPORT COSTS
14241OTHER COSTS
932EDUCATION CONSULTANCY

As the DfE already has the data, they will know how much could be saved just on governance if there were no more than five MATs in each local authority, and legal and accountancy services were purchased from the public sector. Completely rationalising the governance of the school sector should save a nit insignificant amount of cash.

Sadly, I think there is little chance of any significant savings under the present government.

No, No, No, please do not impose a GCSE test on university applicants

There was a discussion this morning on the BBC radio Today programme about a suggestion from Whitehall that everyone claiming a student loan should have a pass in English at GCSE. By English, I assume they mean English Language. I am vehemently opposed to such an idea. Let me explain why.

In the 1960s, when I was in the third year of my sixth form career, with ‘A’ Level grades of BBC in History, Geography and Economics, and a merit in what was then the special Paper, I still didn’t have a pass in English. (After six attempts, I finally succeeded in the following January examination).

Looking to universities where I could apply to study, some of whom had only recently dropped Latin as a compulsory requirement for many subjects, I struggled to find six courses that I could apply for without a pass in English Language.

In the end, LSE, a university with large number of mature students with non-standard entry requirements, Leicester, and a couple of then new universities were my only options. Eventually, I joined my twin brother to study at LSE, following in our father’s footstep, although he studied as a part-time mature student, and I was a full-time day student with both a grant and a scholarship.

So, I oppose any move to ration university places by such an arbitrary measure as a pass in GCSE English, just as I oppose the idea of a sudden death all or nothing Baccalaureate – even the IB, with its many good points.

However, I don’t just rest my opposition on the basis of my personal testimony.  As previous posts on this blog have demonstrated, the education offered to pupils that put their trust in the State to educate them varies significantly from place to place, and over time.

After a period of teacher shortages, lasting more than a decade, the nation may now be moving towards a period when becoming a teacher becomes more difficult and everyone can be taught by teachers qualified in their subject.

But, should those teaching music, art, parts of design, and other subjects be restricted by a requirement to be proficient in English before taking a degree course?

Well, of course, they already are if they want to be a teacher, as ITT has minimum standards. When undergraduate teaching degrees were still commonplace, universities used to set approved tests for those without the paper qualifications in English. I guess such local tests would be a way around any new requirement. However, if the government mandated that access to student loans required either a pass in English or any other such approach, individual institutions might find circumventing the new rule more of a challenge.

The figure of 33,000 students without a pass in English was mentioned in the radio piece. However, we weren’t told what subjects they were studying. There may well be a debate about the numbers going to university, but as a society I would hope that we had moved beyond such an arbitrary rule: then I look at requirements for entry into school sixth forms, and know that today, I would not even have made it to ‘A’ Level, and those grades I acquired, in far too many schools.

We may need more cash for defence, but not at the expense of the education of late developers, those brought up in the wrong geographical area, and those facing the many other barriers already in place for our young people considering higher education and a degree.

Is Labour wrecking London’s Schools?

This blog has revealed in a previous post how in many London borough the fall in pupil numbers in the primary sector has resulted in a worsening of the pupil teacher ratios (PTRs) in many boroughs. Worsening PTRs will most likely mean larger classes or greater use of unqualified staff to ‘teach’ children. Falling rolls in London: much worse than the rest of England | John Howson

A closer examination of the data reveals that the boroughs with greater issues of deprivation seem more seriously affected by the worsening PTRs. However, boroughs are frequently not homogenous in nature. Haringey has affluent Highgate in the same borough as Bruce Grove and Wood Green.

As a result, it is worth looking at the data from the lens of a smaller unit such as the parliamentary constituencies, although it has to be acknowledged that many of those are also not homogenous:  Edmonton & Winchmore Hill and Southgate and Wood Green both spring to mind as two constituencies with very different localities within them. However, constituencies are better than boroughs and larger than council wards – too small for this exercise.

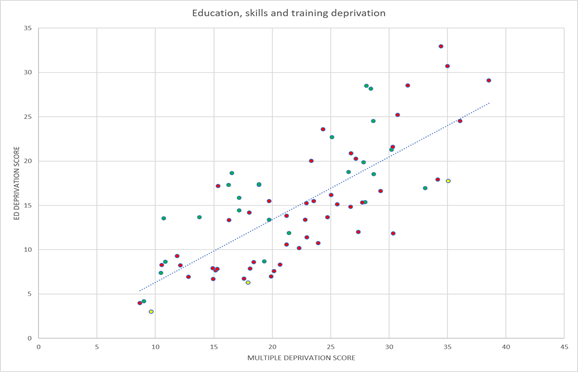
The following chart plots the index of multiple deprivation score for each current London parliamentary constituency against the index of education, skills and training deprivation taken from the work undertaken by the House of Commons library  Deprivation in English constituencies, 2025 – House of Commons Library

The red dots on the plot are constituencies where the PTR in the constituency, as measured by the DfE, has worsened between 2022/23 and 2025/26. The green dots show constituencies where the PTRs has improved, and the yellow dots are where the PTR was the same in the most recent year as it was in 2022/23.

As expected, there is a strong correlation between constituencies with a high score for multiple deprivation and their score on the education, skills and training deprivation index. However, many constituencies with high deprivation scores have also seen their PTRs worsen – red dots on the chart.

Of course, London primary PTRS are still some of the most favourable in the country, but just not as good as they were a few years ago. The question therefore arises as to whether worsening PTRs will lead to a deterioration in outcomes from the levels achieved in the quarter century since the introduction of the London Challenge and all that went with it.

It is also worth noting that the data was based upon the ratio of qualified teachers to pupils. Many London schools have unqualified teachers, employed through programmes such as Teach First and the apprenticeship scheme. However, both schemes are more common in the secondary sector than in primary schools.

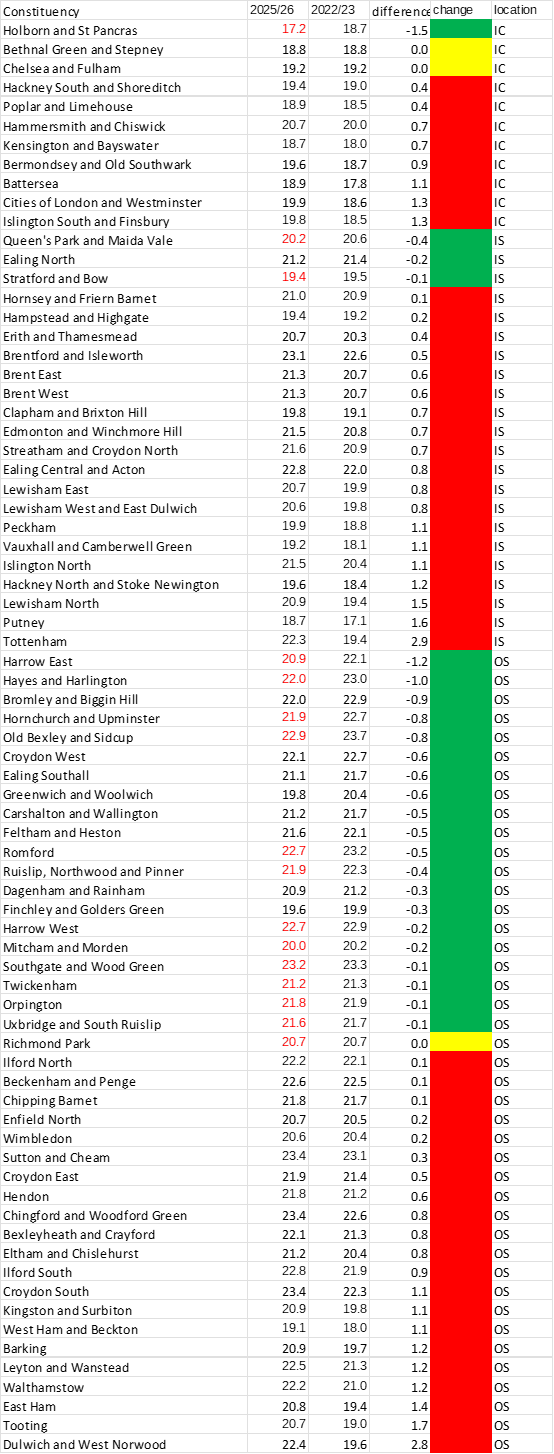
The following table lists the changes in primary PTR by constituency and adds my view of whether each constituency is an:

Inner-City        IC

Inner Suburb  IS

Outer suburb OS

Constituency. This is a subjective judgement on my part, but it does reveal that from the list that Holborn & St Pancreas appears to be the only inner-city constituency with an improved PTR over the period. Why that should be is an interesting question that cannot be answered from the data alone.

It’s the numbers not the percentages that matter most

Each year, the DfE publishes details about the workforce in schools. The data about teacher numbers are collected in the School Workforce Survey, conducted every November.

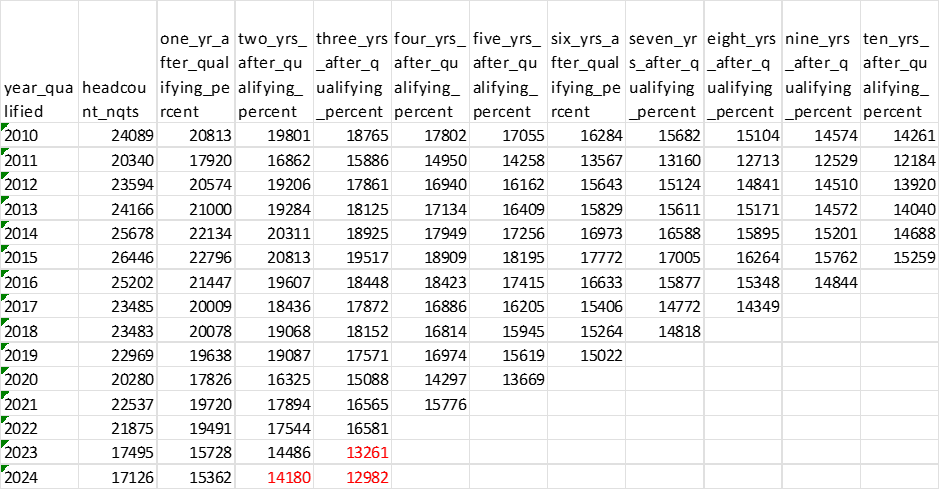
Included in the data are details about teacher retention in state funded schools. Interestingly, although the DfE provided the actual number of NQTs each year, the retention data is shown as a percentage of that base number. Release home – School workforce in England – Explore education statistics – GOV.UK as demonstrated in the following table.

The picture is obvious, despite some late arrivals after qualifying, the percentage falls for each extra year of service, so that of the 2010 cohort, only 59.2% were still in service after 10 years.

 Over the past few years, the percentage in service after one year has fluctuated from a low of 85.1 for the 2016 cohort to a high of 89.9 for 2023 cohort, with the 2024 cohort still doing well, with a retention rate of 89.7% at year 2. This looks like good news for the government.

However, there is less good news for the cohort that joined during covid in 2020 and 2012. For these two cohorts, retention after four and five years is poor, and back to levels last seen in 2014 for the 2021 cohort.

So, good news, retention is improving. Might the government even meet its target of of 6,500 extra teachers? Now it is time to change the percentages into numbers.

Here the picture is different. I have projected an extra year for the 2024 cohort and two years for the 2023 cohort just to show what might happen. The behaviour of those two cohorts is very important as they represent the lowest intakes of NQTs since 2010. Sadly, the government doesn’t publish the table by sectors. This is important because it is the key secondary subjects that already start with shortages where retention really matters for the performance of the school system, and especially for the outcomes for children in schools with high percentages of pupils on Free School Meals.

The current ten-year loss numbers show a worrying trend.

Hopefully, this loss of experienced teachers will reduce over the next few years, as the cohorts following the 2015 cohort have better retention numbers and percentages. The real concern is the 2020 and 2021 cohorts.

However, with falling rolls, starting to appear in the secondary sector, and already seriously affecting the primary sector in London, the retention rates for teachers may well improve, if schools can continue to afford the same number of teachers.

As my previous posts have made clear, the relationship between the National Funding Formula and pupil numbers will be crucial to future size of the teaching force. Falling Rolls: Is the funding formula making matters worse? | John Howson

Falling rolls in London: much worse than the rest of England

In my last post on this blog, I looked at the worsening of primary PTRs across much of the DfE’s ‘Inner London’ area. Falling Rolls: Is the funding formula making matters worse? | John Howson

This post looks how ‘Inner London boroughs have fare compared with the rest of England over those three years?

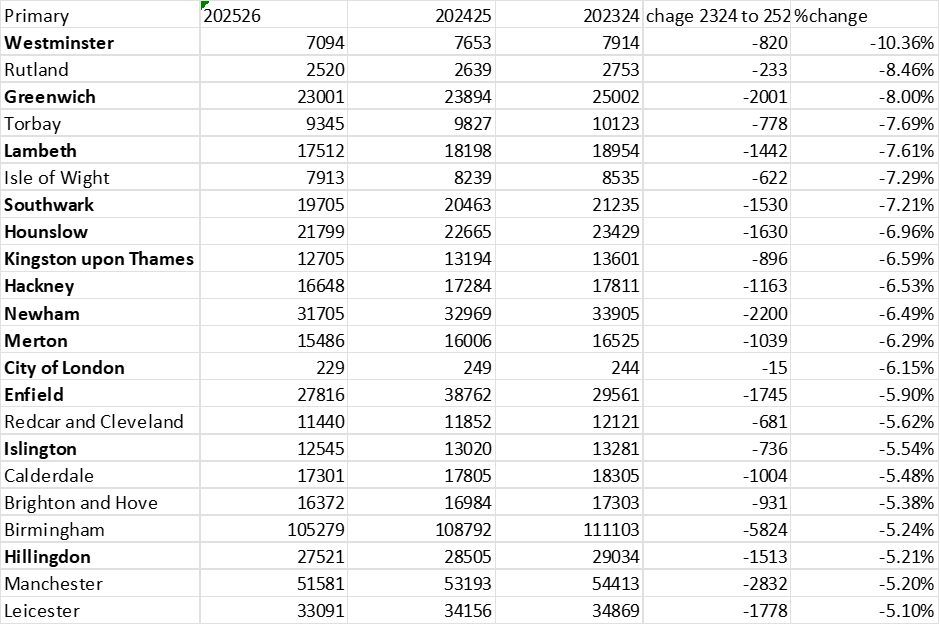
I think it is fair to say that London as a whole really has seen a significant downturn in primary pupil numbers. There are 22 local authorities where primary pupil numbers as published by the DfE have reduced by 5% or more between 2023/24 and 2025/26. Of these, 13 are London boroughs, and six – seven if Newham is included – are Inner London boroughs.

Seven of the top 10 places for the largest percentage decline in primary pupil numbers are filled by London boroughs. The other three places are taken by the Isle of Wight, Rutland and Torbay, three of the smallest unitary authorities in England.

Birmingham, Manchester and Leicester are the only large cities in the table. They fill three of the four bottom places for local authorities with a decline in pupil numbers of five per cent or more, along with Hillingdon in West London.

At the other end of the table, there are few London boroughs with less than a two per cent decline in their primary pupil populations.


London boroughs at this end of the table seem to be mostly outer London boroughs on the fringe of the metropolitan area. By contrast, there are seven county councils in the list of lowest declines in pupil numbers. This number increases to eight, if the Staffordshire figure, of an increase in pupil numbers, is correct.

The London boroughs will have the numbers in reception for each year, and will know how much worse the decline is likely to become over the next few years. More school closures look inevitable unless the funding model is changed to protect schools with declining rolls.

Not to protect the school estate in London is to assume that there will never be an upturn in pupil numbers. In cities, closing schools and selling off the site for housing means that in any upturn land may not be available for any new schools needed for the extra pupils. This is where thinking for the longer-term is important. During the last downturn of this size, most schools in London remained open, although some, such as Stamford Hill Infant and Junior School in Haringey, where I attended in the 1950s, did eventually close. Interestingly, the one form entry St Anne’s Church of England Primary School, close to Stamford Hill School that wasn’t actually in Stamford Hill, is still open.

However, this is not the post to discuss whether or not, in a more secular society, faith run schools should be closed where an alternative non-faith school can absorb the pupils. But this is an issue to debate, especially in urban areas.

In villages, the church-run school may still be the only school available, and that raises a much larger question about who should run state funded schooling? As the Wesleyan Methodists put it when faced by the 1902 Act, and decisions on whether to open state-funded secondary schools; are our teachers, teachers of children or teachers of Methodist children?

Falling Rolls: Is the funding formula making matters worse?

There has been a lot of discussion recently about falling school rolls in the primary school sector in London. This discussion led me to wonder whether a funding formula that is heavily weighted to a per pupil funding model might mean schools with falling rolls would have to adapt to a decrease in their income.

One possible outcome of less funding could be a worsening of pupil teacher ratios if individual support for pupils with SEND is cut, and also whole classes are amalgamated. My thesis is that Inner London boroughs might be witnessing the worst of the falling rolls problem, partly because they are boroughs with little room for new housing to be built, but also because inner cities have traditionally been the home of new arrivals to a country. Post Brexit, many European families from countries such as Poland and Romania may also have chosen to return home, taking their children with them.

With the release last week of the school workforce data for 2025/26, by the DfE, it is possible to review the pupil teacher ratios (PTRs) for each borough for the three-year period from 2023/24 to 2025/26.

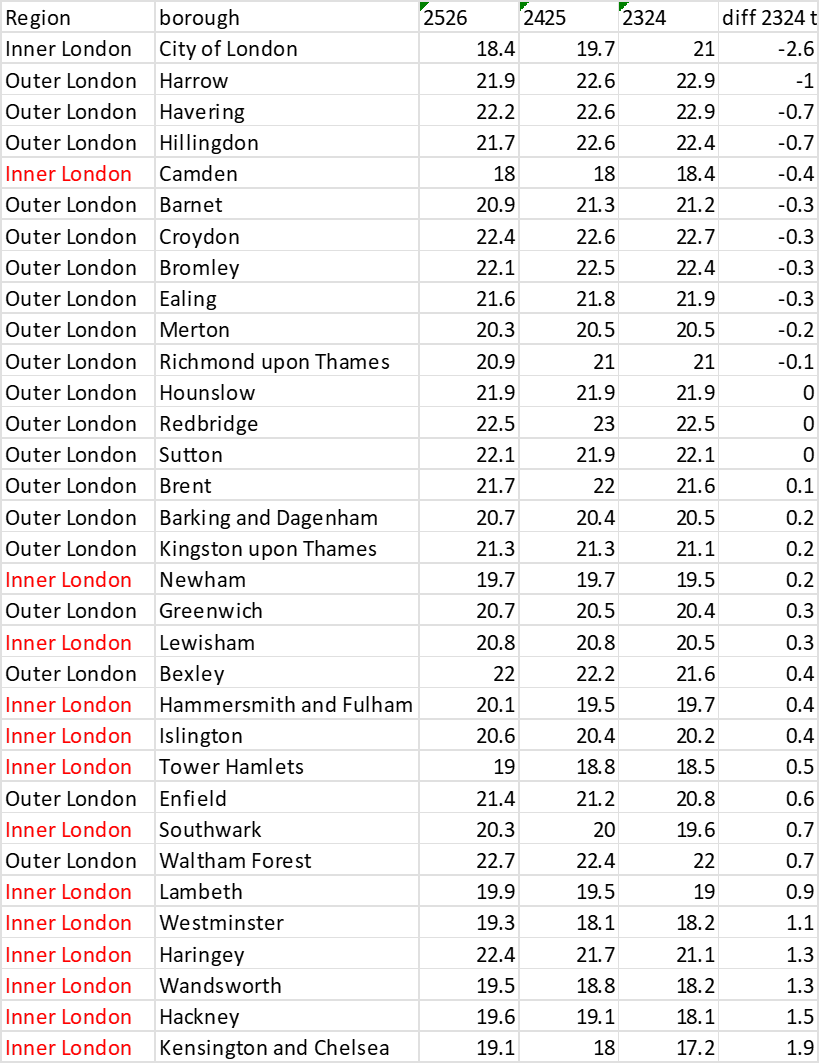
Of the boroughs in London, including the City of London, 11 boroughs improved their primary PTRs between 2023/24 and 2025/26. All but one, Camden, were Outer London boroughs. All the other Inner London boroughs recorded a worsening of their primary PTRS over the three- year period.

In the case of Kensington and Chelesea, albeit a small borough, the change was from 17.2 to 19.1 pupils per teacher over the three years: a decline of some 10%. This is a relatively large change for such a short period of time.

Seven Outer London boroughs also recorded a worsening of their primary PTRs over the same period. Of these boroughs, two, Newham and Greenwich have been classified as Inner London boroughs at sometime in the past.

Apart from the City of London, the boroughs with most improved PTRs are on the edge of London – Harrow, Havering, Hillingdon, Barnet, Croydon and Bromley.

The data in the table does suggest that falling rolls have been accompanied by a worsening of PTRs. Might this be caused in part by the construction of the National Funding formula that is heavily weighted towards a per pupil element? Reduced funding is certainly likely to impact upon class sizes and the use of teachers with small groups. Increasing class sizes and cutting individual teacher support for vulnerable learners is likely to impact upon a school’s PTR. If the reduction in pupil number sis widespread across a borough, then the impact will be seen in the PTRS for all primary schools in the borough.

I think that there is a case to be made that falling rolls are worsening PTRs for the remaining pupils across much of Inner London.

For a longer-term analysis of PTRS in London, and how over time they have been better than in most of England see  (1) (PDF) PTRS OVER TIME: A REVIEW OF PUPIL TEACHER RATIOS BETWEEN 1974 AND 2024 AND TWO PERIODS OF LOCAL GOVERNMENT RE-ORGANISATION PTRS OVER TIME: A REVIEW OF PUPIL TEACHER RATIOS

Demand for music teachers: where were the jobs in early 2026?

This post follows on from my previous post, written yesterday, and looks in more detail at the vacancies for music teachers tracked since January 1st 2026. Music teachers: labour market update | John Howson

Due to further data cleansing, the numbers may slightly differ from yesterday in some respects after mis-allocations in certain fields have been corrected.

Vacancies are generally either for a main scale/Upper Pay Spine post or for a promoted post.

In terms of the ratio of promoted posts with a TLR, or in a few cases a Leadership Scale offer, to posts without any additional allowance, the East Midlands region tops the list at 37% of advertised posts with a TLR.  At the other end of the scale, no promoted posts have been recorded for the North East. It may be that schools in the North East use regional job boards for promoted posts. Those boards are currently out of scope of my survey.

The East of England region also had a lower-than-average percentage of promoted posts in the total of advertised vacancies. However, this may be partly due to the larger than average number of posts advertised without any additional pay supplement dragging down the percentage of promoted posts.

Most promoted post are TLRs advertised as a 2b.

In terms of the need to re-advertise vacancies for teachers of music, there are three clear regional groups: the East Midland and East of England with well above average levels of schools re-advertising; Yorkshire and The Humber region where, to date, no re-advertisements have been recorded, along with the West Midlands, North East and South West, regions with well below average levels of re-advertisements.

The remaining regions have re-advertisement rates broadly in line with the national average. Of course, there is still time for other schools to re-advertise before the end of the summer term. However, as they would only be attracting ITT completers or returners, this might be something of a futile exercise, only worthwhile if at no cost, such as using the DfE vacancy website.

Interesting questions that arise from the data are: how well does ITT provision map with demand and are there any characteristics of schools that re-advertise vacancies – high free school meal percentages; excellent music departments; high-cost housing areas; long distance from ITT provision no recent history of schools being used by trainees?

Other interesting questions to research include: the balance of full-time versus part-time vacancies and between permanent and temporary vacancies; and how many of the latter are as a result of a teacher taking maternity leave? Fortunately this data has been collected along with whether or not the school is an academy and if the post is eligible for visa sponsorship: most are not.

If I have the time, I will try and address some of these questions in the round-up after the end of the summer term in August. Meantime, any views would be welcome in the comments section.

Music teachers: labour market update

One of the leitmotifs of this blog has been around the labour market for teachers, from numbers entering training, through vacancies for teachers, to the numbers of teachers that are in-service.

This academic year, I have been tracking the data on vacancies for headteachers – a study started more than 40 years ago – and vacancies for teachers of music. This is as a part of my campaign to see the bursary returned to trainee teachers of music, after the Labour government axed it an act of cultural vandalism that I might have expected from other political parties, but not from Labour.

Anyway, enough of my rant. Does the data support my thesis that there are not enough music trainees this year, even with the bursary, and that any reduction in trainee numbers will affect the 2027 labour market, making it more difficult for schools, and especially secondary schools in challenging circumstances, to recruit music teachers? For earlier discussions on this point see:  Music teachers: bring back the bursary | John Howson and Reviving Music Teacher Bursaries: A Necessity | John Howson

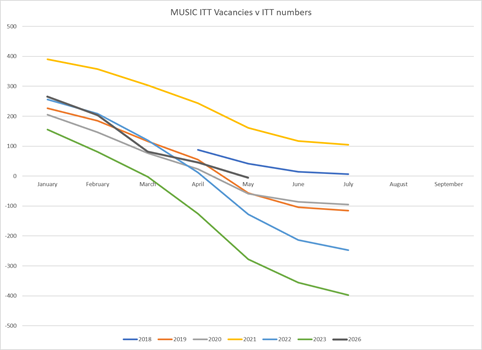
The graph in this post shows recorded 2026 vacancies for main scale teachers of music (no TLR) advertised since the start of January2026, and recorded from both the DfE vacancy site and the tes job board. The 2026 data have been plotted against previous years data, collected by TeachVac from school websites and local authority job boards.

The plotted line is the residual, reached after subtracting the recorded vacancies from number of trainees contained in the DfE’s ITT census published in the December 2025. By Friday 29th May 2026 the residual number had just turned negative; meaning more vacancies recorded than trainees possibly available to enter the labour market.

Two caveats are required at this point: not all trainees will complete their course, and of those that do, not all will enter teaching in state schools – some with not teach, others will teach in Sixth Form Colleges, and yet other will teach in the independent sector that now comprises a significant proportion of ‘A’ Music level entries. The second caveat is that in addition to trainees, there will be other entrants into the music teacher labour market. Some other entrants will be switching schools, but possibly most will be doing for a teaching job with a TLR. Then there will be those returning to state school teaching either from other jobs or a career break. This group will become increasingly important for the job market as the rest of 2026 unfolds, and the new entrants into teaching either find a teaching post in a state school of opt to work elsewhere.

For various reasons TeachVac stopped collecting data in 2023, so the data for 2024 and 2025 is missing. Comparing 2026 with earlier years, shows a trend worse than before covid, but better than in 2022, and the disastrous 2023, when poor recruitment into ITT in 2022 and the number of new schools opening in response to the increase in the secondary school population ensured a higher-than-normal demand for teachers. However, here was my analysis in June 2023 TeachVac’s index shows depth of teacher recruitment crisis | John Howson

For the current market outcome, if you discount the ITT 2025 census total by either 10% or 20%, for numbers in the census not likely to enter mainstream school teaching in the secondary sector, then the current negative residual at the end of May 2026, of -5, worsens to either -41 or -78.

This number assumes that vacancies tracked cover the whole market and that regional or other job boards, such as within large MATs, that are not counted in my survey have not seen many vacancies not placed on either the DfE or tes site.

Some schools may have offered trainees working in their schools a job, and saved on advertising costs. However, without more detailed surveys, such jobs would be difficult to account for.

One issue overcome by direct verification of the DfE and tes sites, is the thorny question of re-advertisements and repeat advertisements. The data used in this report ignores any second or subsequent advertisement by a school for a teacher of music unless it is significantly different to any previous advertised vacancy. Examples include a part-time post when the previous vacancy was for a full-time teachers and a maternity leave temporary post following one for a permanent appointment.

In a future post, I will look into the characteristics of schools that have re-advertised a vacancy.

After weighing the data on vacancies so far, and trends in ITT recruitment – see More thoughts on the ITT round for 2026 | John Howson – I think the removal of the bursary by the DfE was a risk, and that it may damage the future of music in state secondary schools in the future. I look forward to being proved wrong.

Are there now two classes of NEETS: traditional and Modern?

Most of the comments about yesterday’s report on NEETs (not in Education, Employment or Training) Young people and work: interim report – GOV.UK by Alan Milburn,  focused on the outcomes, especially the rising percentage of NEETs in the population. Fewer commentators delved deeper into the report to look at some of root causes that are likely to increase the chances off someone becoming a NEET.

I think there are now two groups of NEETs. The long-standing group, discussed below, and a newer second group of university graduates, unemployed or underemployed by age 25. This second group requires different approaches to the first group, but could be disproportionally affected by the increasing importance of AI in the labour market, and especially the loss of entry level jobs that is akin to the loss of manual labour jobs over the past half century. I will reflect upon this issue in another post.

For the first group, the following extracts from yesterday’s Report once again tell us everything we need to know: fail early, fail often.

4.2 Early years: where the trajectory begins

302. The system knows, from the moment a child arrives at school, who is most likely to fail. It has the data, and the unambiguous evidence. A study of over 8,000 young people in Bradford found that children who were not school-ready at ages 4 to 5 were nearly three times as likely to be NEET at ages 16 to 17 years old. 11% of those who did not reach a Good Level of Development at reception were later NEET, compared with just 4% of those who did.[footnote 273] Research tracking children from school entry through to their late teens shows that most of this effect operates through academic attainment.[footnote 274] A child who falls behind at 5 years old is on average still behind at 16 years old. Missing early building blocks propagates forward through every key stage. Around 65% of the relationship between school readiness and later NEET status runs through this academic pathway.[footnote 275]

4.3 Schooling

The attainment gradient

309. Taken on its own terms, much of the schools system looks relatively strong. In England, those aged 15 perform above the OECD average in reading, maths and science.[footnote 287] Level 2 attainment in English and maths by age 19 reached 76.1% in 2023 to 2024, the second highest on record,[footnote 288] although it has fallen back slightly to 73.2% in 2024 to 2025.[footnote 289] Those aged 16 to 19 score above the OECD average in literacy and adaptive problem solving, with significant improvements in literacy and numeracy since 2012.[footnote 290] Only around 5% of non-disadvantaged young people fail to enter a sustained destination after Key Stage 4.[footnote 291]

310. And yet the relationship between social background and educational attainment in England is unbroken. It has survived every reform of the past three decades. Disadvantaged children still perform substantially worse at every stage of education. The gap does not close as children move through the system. It widens.

311. At age 7, the most disadvantaged pupils are 16 percentiles behind their most advantaged peers. By age 18 or 19, the same young people are 29 percentiles behind.[footnote 292] 12 years of schooling, and the gap has nearly doubled.

312. The damage begins early and locks in at primary school. At Key Stage 2, just 47% of disadvantaged pupils reached the expected standard in reading, writing and maths, compared with 69% of their peers, a 22 percentage point gap.[footnote 293]

313. Primary schools do not receive the same level of attention in the public debate on education as secondary schools.  Perhaps that is why the ambitions that have been set for primary school children are surprisingly low.  On the face of it, it is astonishing for example that successive governments have set targets for primary schools to only have 75% of their pupils leaving with the age-appropriate level of numeracy and literacy skills.  In other words, the State assumes that one in four will never achieve that standard.

As I wrote about an earlier Social Mobility Commission Report, Education counts, but so does the family | John Howson

[This report] “raises a number of interesting questions. Most are not new, but they are none the worse for restating.

Life changes, at least as far as incomes are concerned, seem to be a combination of education, local labour markets, soft skills and parental ability to offer support for life chances.” John Howson Blog 15th September 2020

We have also known for a long time the importance of ‘soft skills. Here is an extract from my blog written after an earlier Social Mobility Commission Report

In 2009, I concluded that ‘the activities relating to having fun and socialising are the key activities of out-of-school activities.’ The Social Mobility Commission chairman has concluded that

“It is shocking that so many children from poorer backgrounds never get the chance to join a football team, learn to dance or play music. The activity either costs too much, isn’t available or children just feel they won’t fit in. As a result, they miss out on important benefits – a sense of belonging, increased confidence and social skills which are invaluable to employers. It is high time to level the playing field.”  Blog July 19th 2019 The importance of soft skills and those that miss out | John Howson

Even earlier, after a Social Mobility Commission of 2017, I commented that

“Of most concern in the report is the fact that there is still general acceptance that educational opportunity is still shaped by background, with those from poor backgrounds having least opportunities and that the level of opportunity deteriorates between school and university.” June 15th 2017  Class rules: not OK | John Howson

Go even further back to 2014, and an early post on this blog commented about social mobility that

“The Commission also discuss parental involvement and the poor quality of career advice that is often linked to low expectations. More must be done to encourage parents that the education system failed not to let the same thing happen with the next generation. Breaking the cycle of hopelessness is a vital component to raising standards as the Commission acknowledges. How to disseminate best practice rather than ritual nods to devolving training to schools and Teach First might have allowed for discussion about the content of both initial training and professional development of teachers.

Where I do agree with the Commission is in the vital role played by primary schools and the need to focus more attention on success in the early years. Regular attendance and strategies to help pupils that miss school are important moves in helping all pupils achieve success as last week’s publication of the EYFS profiles showed.

For anyone interested in the issue of social mobility this is an important but at times challenging and even depressing Report to read. It can be found at” https://www.gov.uk/government/uploads/system/uploads/attachment_data/file/364979/State_of_the_Nation_Final.pdf

 Blog post 21st October 2014.

So, way back in 2014, much the same comments were being made as in Section 4.2 of the current report, quoted at the start of this post.

We have a lost generation after what happened to those in early years after 2014, including and the slaughter of the Children’s Centres, the banishment of vocational skills from the curriculum, and a decade of teacher shortages leaving many disadvantaged pupils floundering at school in a system that was more interested in tacking organisation issues than creating a school system for all.

Sir John Newsom must be turning in his grave. Half Our Future: A tribute | John Howson