This blog has revealed in a previous post how in many London borough the fall in pupil numbers in the primary sector has resulted in a worsening of the pupil teacher ratios (PTRs) in many boroughs. Worsening PTRs will most likely mean larger classes or greater use of unqualified staff to ‘teach’ children. Falling rolls in London: much worse than the rest of England | John Howson
A closer examination of the data reveals that the boroughs with greater issues of deprivation seem more seriously affected by the worsening PTRs. However, boroughs are frequently not homogenous in nature. Haringey has affluent Highgate in the same borough as Bruce Grove and Wood Green.
As a result, it is worth looking at the data from the lens of a smaller unit such as the parliamentary constituencies, although it has to be acknowledged that many of those are also not homogenous: Edmonton & Winchmore Hill and Southgate and Wood Green both spring to mind as two constituencies with very different localities within them. However, constituencies are better than boroughs and larger than council wards – too small for this exercise.
The following chart plots the index of multiple deprivation score for each current London parliamentary constituency against the index of education, skills and training deprivation taken from the work undertaken by the House of Commons library Deprivation in English constituencies, 2025 – House of Commons Library
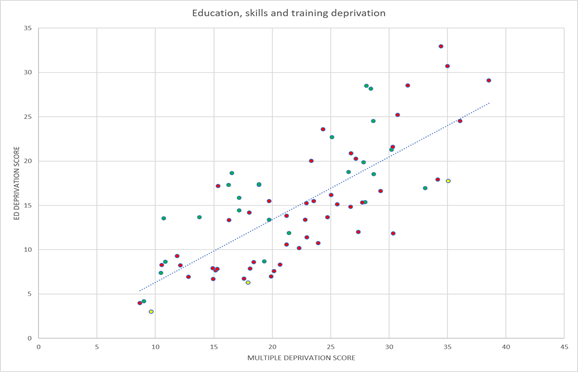
The red dots on the plot are constituencies where the PTR in the constituency, as measured by the DfE, has worsened between 2022/23 and 2025/26. The green dots show constituencies where the PTRs has improved, and the yellow dots are where the PTR was the same in the most recent year as it was in 2022/23.
As expected, there is a strong correlation between constituencies with a high score for multiple deprivation and their score on the education, skills and training deprivation index. However, many constituencies with high deprivation scores have also seen their PTRs worsen – red dots on the chart.
Of course, London primary PTRS are still some of the most favourable in the country, but just not as good as they were a few years ago. The question therefore arises as to whether worsening PTRs will lead to a deterioration in outcomes from the levels achieved in the quarter century since the introduction of the London Challenge and all that went with it.
It is also worth noting that the data was based upon the ratio of qualified teachers to pupils. Many London schools have unqualified teachers, employed through programmes such as Teach First and the apprenticeship scheme. However, both schemes are more common in the secondary sector than in primary schools.
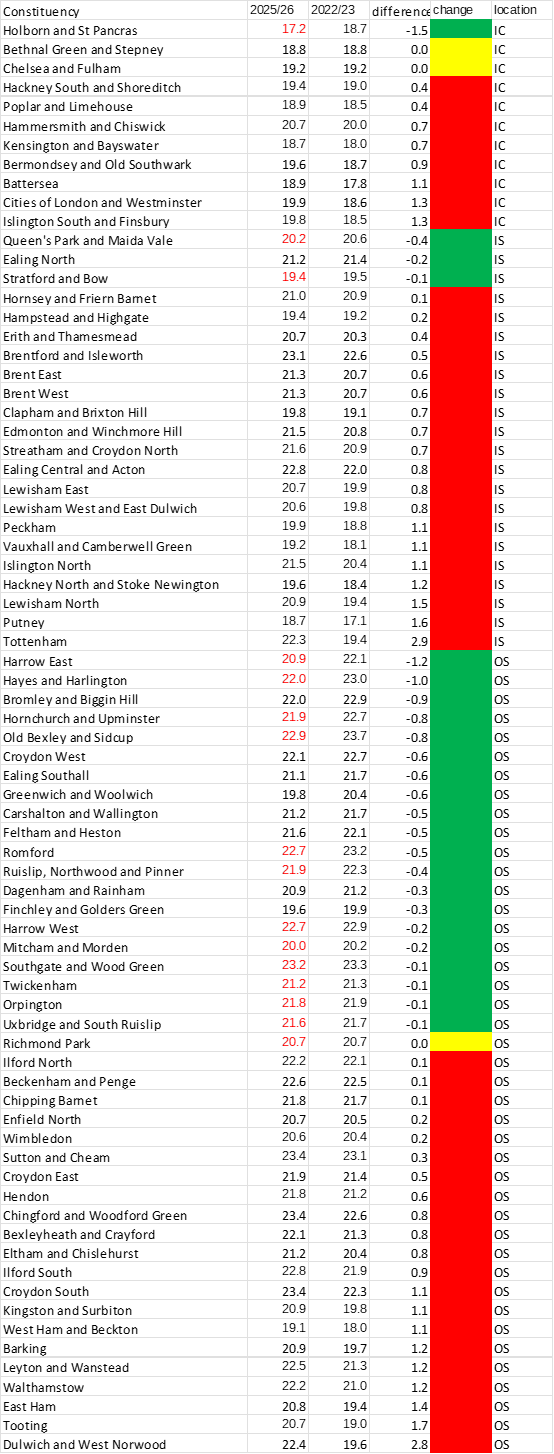
The following table lists the changes in primary PTR by constituency and adds my view of whether each constituency is an:
Inner-City IC
Inner Suburb IS
Outer suburb OS
Constituency. This is a subjective judgement on my part, but it does reveal that from the list that Holborn & St Pancreas appears to be the only inner-city constituency with an improved PTR over the period. Why that should be is an interesting question that cannot be answered from the data alone.