Religious Education – the need for qualified teachers

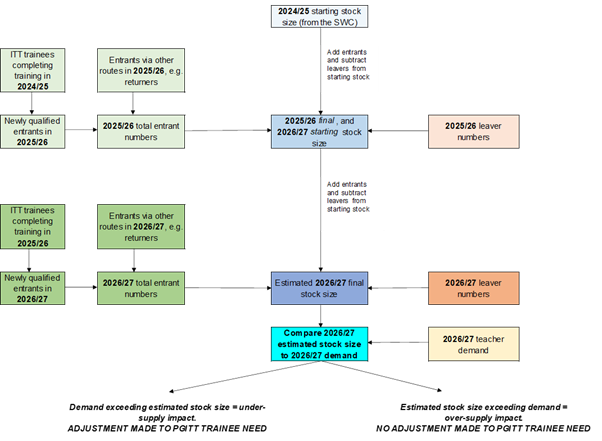
In a recent post on this blog about the DfE’s modelling of trainee teacher needs, I wrote that

‘However, has this re-assessment of need gone too far? Based on … my own current research into vacancies for teachers of music, I think the DfE has been realistic in its approach. ‘

While, I stand by that judgement, I have also been reminded by Deborah Weston, championing on behalf of those concerned with the teaching of religious education in schools that the cutback in trainee numbers probably allows little room for the replacement of the ‘under’ or even ‘un-qualified’ teachers currently teaching religious education in our schools.

Prompted by Deborah, I looked at the trends from the Teacher Workforce surveys concerning the use of those with ‘no qualification in the subject’ teaching religious education over the period between the end of the Blair/Brown Labour government and the end of the Conservative period of government. Of course, recent years have been impacted by the covid pandemic, and its consequences, but there is a clear trend that is observable.

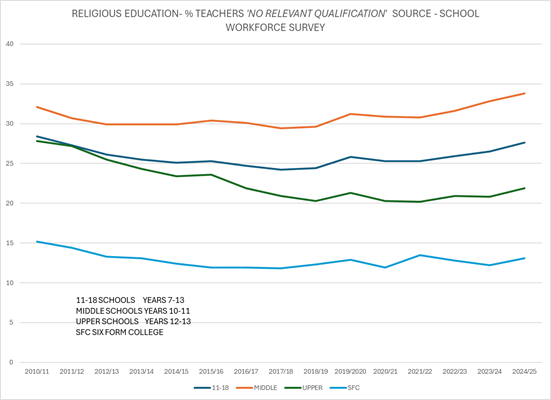
The chart shows the four key types of secondary schools, of which the 11-18 school line is probably the most significant.

At the end of the Labour government, partly I expect as a result of the economic crisis of 2008, the percentage of teachers of religious education with ‘no qualification in the subject’ was reducing. However, the percentage levelled out as school rolls began to increase again, and teacher supply entered into an extended period of years when teacher preparation programmes missed their targets.

There was a brief respite as a result of covid, but in the most recent years, as trainee numbers have fallen, so the percentage of teachers with ‘no qualification in the subject’ has reached levels not seen since well before 2010.

As a result, the question now is, was the DfE right to cut trainee targets for religious education from 780 last year to 450 this year? On the basis that including unfilled places from previous recruitment rounds was a mistake, as I have always maintained, then the answer is clearly, yes, the DfE have taken the correct decision.

However, in subjects such as religious education, where most pupils only study the subject for a limited period of time each week, managing recruitment is easier for schools, if qualified staff are available.

I would add that in my opinion, religious education when taught by well-prepared and knowledgeable teachers can be a really valuable subject, especially at this time in the history of our multi-cultural society, where both many different faiths are practiced, and a growing minority profess to having no faith in religion at all.

If the government cannot see their way to increase the stated need for trainee religious education teachers, providers can always over-recruit, at least to higher education courses, where government funding isn’t an issue.

In addition to pre-entry training, the DfE might also like to consider another approach to the issue of shortage of religious education teachers: upskilling those presently teaching the subject, but without an appropriate qualification.  If it is important that a subject be offered on the curriculum, it beholds government to ensure it is taught properly.  

Spending cash on upskilling will no doubt help retention, and thus save on recruitment and training costs. However, apart from in mathematics and the sciences, it hasn’t really featured as a policy objective for many years: surely that’s a mistake.

I hope that the religious affairs lobby is able to persuade the government that significantly reducing the percentage of inappropriately qualified teachers of religious education should be a key policy objective.

ITT Offers – public money being wasted?

The DfE has today published the April data on postgraduate ITT courses, as at 20th April 2026. Initial teacher training application statistics for courses starting in the 2026 to 2027 academic year – Apply for teacher training – GOV.UK

This is the first month where offers can be compared with the DfE’s required need for each subject for September 2026 courses. I have previously posted about the draconian changes to the demand in many subjects as required by the DfE that have resulted from a different approach to unfilled vacancies. ITT Numbers for 2026 – brutal realism from DfE or big risk? | John Howson

Here is my assessment of possible outcomes for September, when courses commence, based upon current offers and past trends. It will be interesting to see how my view compares with that of Jack Worth at NfER.

SubjectTarget 2026/27offer April 2026DfE identified needFILL?
Chemistry690829-139YES
Biology675398277YES
Mathematics20001752248YES
Design & Technology620382238POSSIBLY
Art & Design605449156YES
Geography685353332POSSIBLY
Classics753639NO
English19801176804PROBABLY
Drama370207163PROBABLY
Business Studies1200224976NO
Music26016199POSSIBLY
Religious Education450339111POSSIBLY
Others20353721663NO
History520736-216YES
Modern Languages1085946139YES
Physics8101140-330YES
Physical Education6551175-520YES
Computing56553926YES

In some subjects, such as history, physics!, physical education and chemistry, providers have already made more offers than required ‘need’.  This demonstrates the danger of leaving it so late in the recruitment cycle to announce estimated demand.

In the past, these numbers used to appear before Christmas. With a rolling offer system in place, rather than a defined closing date, leaving the announcement of ‘need’ until April is likely to cost someone money. Will the DfE pay bursaries to all students offered a place, even if recruitment is above the stated ‘need’? If so, that could be seen as a waste of money.

However, of more concern are the subjects where, even with the new numbers for ‘need’, there are unlikely to be enough applicants to fill all the places. Based on previous trends, classics, business studies and the ’others’ grouping will not meet their ‘need’ number. I think it is time that the ‘other’ category, with 2,035 places is disaggregated into different subjects, after all, it is now by far the largest group in the subject’s table.

I have some concern about where design and technology, geography, music and religious education will produce enough offers to meet the revised ‘need’. However, I can now see why the bursary was removed from music. I still think that was a serious error of judgement, as this is a subject where only those with appropriate subject knowledge are accepted onto courses. Music has one of the highest applications to offer ratios of any subject. Current offers are the second lowest April ‘offer’ number since 2018.

What happens in the wider economy, and graduate job market, will determine the outcome of this recruitment round. I suspect there will be a summer surge in applications, as new graduates discover how tough the job market has become. This should mean a good year for teaching course. However, many applicants may now have found they have left it too late to secure a place for this autumn. This year will really be a case of ‘the early bird that catches the worm’.

I will now delve deeper into the data for another post about the nature of applicants and applications as revealed in this month’s data.

DfE Vacancy site – some more thoughts

The DfE vacancy site has now been in operation since 2018. During that time, it has altered little in appearance. Right from the start of the site, I was critical of its features. I felt then that TeachVac and other sites could have done a better job for much less money. I posted my frustration about the site in both January and March of this year.

After another infuriating day working on the headteacher vacancies listed on the DfE’s vacancy site yesterday, I though I would take a further look at what was on offer in terms of headteacher vacancies.

First off, the DfE site told me there were, in total, 122 vacancies, if I used their pre-defined key word of ‘headteacher’. The vacancies are presented in a list order covering 13 pages. However, there are not 122 vacancies for a headteacher.  10 of the posted vacancies are either for Executive Headships of more than one school (2) or posts below a headship (8 vacancies). Indeed, one vacancy isn’t even a teaching post. So, the real total of headteacher vacancies is 112?

No, sorry, that is not correct either. This is because 10 of the vacancies, including one non-teaching vacancy, appear twice on the site. As a result, the actual number of schools advertising for a new headteacher on the DfE vacancy site at 0900 on the 25th April 2026 was actually 102. That’s 20% below that stated figure.

Now, I have nothing against multiple listings. After all, a person might miss the vacancy the first time it appeared: but why only a few random vacancies? I believe such double listings should either be removed from the site – it just requires a simple piece of coding – or the rules about the same vacancy being listed more than once at the same time should be made clear.

Where I do quibble with the DfE, is with the inclusion of posts not for a headteacher vacancy in the listings under the ‘headteacher’ category, and, as a result, their inclusion in the overall total. This is just mis-leading, and schools should be prevented from uploading such vacancies under the ‘headteacher’ listing. Again, this should not be a difficult coding exercise.

The other question is: does the vacancy site meet the needs of schools and candidates? Well, some schools still advertise their vacancy for a headteacher elsewhere. Local authority job boards for non-academy schools; the ‘tes’ as well, or in a small number of cases instead of the DfE site. Some vacancies also appear on regional websites, such as in the North East or South West.

The DfE vacancy site doesn’t accept vacancies from non-state funded schools. Candidates considering both state and private schools have to look at more than one vacancy site. Is this a good idea? I don’t think it matters at the level of headteacher posts, except perhaps for special needs schools, where the private sector is playing an increasingly important role. However, for entry level jobs, some form of aggregation might be useful, especially as candidates begin to outnumber vacancies for the first time in many years.

Does the DfE have a board or committee that reviews its vacancy site? If not, perhaps the teacher association might ask for a review. After all, they would serve their members better by operating such a site themselves. Not only would they have better data on vacancy trends to argue their case with the STRB, but they could also earn some extra income. When I suggested this to the associations in 2013, when I created TeachVac, sadly they weren’t interested.

The Teacher Supply Model

On Thursday, the DfE published its annual note about the working of the Teacher Supply Model Teacher demand and postgraduate trainee need: 2026 to 2027 – GOV.UK

The Model can be easily described in the DfE’s own diagram

It is interesting to note that the Teacher Supply Model

assumes that as pupil numbers grow, teacher demand will grow too, and vice versa. Additionally, the model assumes that PTRs will grow in line with the historical relationship between pupil numbers and PTRs. Similarly, the model assumes that PTRs will fall if pupil numbers fall. In other words, as pupil numbers grow, the TWM assumes that schools will increase the size of the teacher workforce and allow class sizes to grow a little. 

As a result, the Model finds it challenging to manage changes, such as in the curriculum. One of the best examples was the introduction of citizenship during the Blair/Brown Labour government. Schools didn’t sack teachers to make space for teachers trained in the subject, and with no historical data to underpin the need, estimates had to be made.

The assumptions about pupil teacher ratios are, of course, unable to factor in economic headwinds that might change assumptions about future funding of schools. There was a god example early in this century when, in a budget, the Chancellor announced extra cash to be sent directly to schools. Not surprisingly, the schools went after extra teachers and equilibrium in the labour market was only restored by a hike in teachers’ pay that dampened down demand that had not been anticipated in the Modelling.

I have discussed these points with the overseas governments that I have advised on teacher supply modelling over the years. I also favour including a check on what is currently happening in the labour market by surveys of vacancies. Advances in technology, such as pioneered by TeachVac, way back in 2013, allow current trends to be matched with the data input into the Teacher Supply Model that may be two to three years between data collection and the output of trainees based upon the data joining the labour market.

One increasingly interesting issue that the Teacher Supply Model may need to consider is the growing international labour market for teachers. The Model currently imperfectly accounts for loss from the trainee and existing teacher pools to the private sector in England. In the future, it might need to consider how many trainees opt to work abroad. This will be especially important if more overseas students are offered places on teacher preparation courses. Will they be offered visas to teacher in England, or will they leave the country after completion of their courses? I will try to consider this issue in a later post.

Finally, I am delighted that the statisticians have abandoned what they have called ‘the removal of the need for an adjustment relating to forecasted under-supply’.  Adding back in the number of unfilled places from a previous ITT round to the next year’s total was never a good idea, as I have made clear in a number of my posts on this blog. The decline in Physics ITT places from a high of 2,250 in 2024/25 to just 810 for 2026/27 is a good case in point.

However, has this re-assessment of need gone too far? Based on Timo Hanney’s work on vacancies and my own current research into vacancies for teachers of music, I think the DfE has been realistic in its approach. After all, if they have under-estimated demand, the government can always recruit more teachers from overseas by enticing those trained here to return to England.

Does the DfE care about the arts in schools?

In my previous post, I promised more from the DfE’s publication Teacher demand and postgraduate trainee need: 2026 to 2027 – GOV.UK On closer examination of the text, it is clear that a lot of the data has come from the June 2025 publication of school workforce data, collected in November 2024. The next publication with the 2025 workforce data should appear in June, so I will wait until then to review the trends I didn’t cover on this blog last summer, after the publication of the 2024 data.

However, there is an interesting table in this release showing changes in the number of teachers per 1,000 pupils. The time series runs from the end of the last Labour government’s decisions on school funding in 2010/11 up to the 2024/25 school-year. This covers a period when school rolls were both falling, and then rising again. For the primary sector, rolls have been falling for some time. In the secondary sector, rolls are reaching their peak and will drop away over the next few years. The extent of the fall will, in reality, depend upon trends post-16, and whether schools either retain pupils or see then depart for further education or apprenticeships.

The number of teachers per 1,000 pupils is, of course, governed by the curriculum. Mathematics and English are taught to all pupils between Years 7-11, whereas few schools teach Classics to any pupils at all. Hence the ratio for mathematics was 8.44 in 2025/26, and has changed little since 2010/11, when it was 8.39 teachers per 1,00 pupils. By contrast, classics come out at a constant 0.09 teachers per 1,00 pupils.

The number of teachers per 1,000 pupils
by secondary subject as published in this publication
Subject2010/112024/25difference% Difference
Computing3.471.77-1.7-49%
Design & Tech5.133.1-2.03-40%
Drama1.751.35-0.4 -23%
Art & design2.812.19-0.62-22%
PE6.254.98-1.27 -20%
Other Sub5.124.08-1.04-20%
Business studies1.911.55-0.36-19%
Modern F L4.643.91-0.73-16%
Music1.671.42-0.25-15%
Biology3.93.41-0.49-13%
All Sec68.0959.77-8.32-12%
RE2.322.2-0.12-5%
Chemistry3.163.08-0.08-3%
Primary48.1747.04-1.13-2%
Classics0.090.0900%
English8.78.700%
Mathematics8.398.440.051%
Physics2.692.720.031%
History3.213.50.299%
Geography2.93.270.3713%
Source: DfE School Workforce data

Interestingly, for a country concerned about ‘growth’, and the decline of the productivity of the economy, the subjects with the largest falls in teacher numbers per 1,000 pupils are computing (down 49%) and design and technology (down 40%). By contrast, the humanities subjects, of history and geography, have seen increases in the number of teachers per thousand pupils. Presumably part of this increase was the inclusion of these subjects in the English Baccalaureate by the previous Conservative government.

The arts have generally not fare very well. This is despite the ease of recruiting teachers in these subjects during much of the period reviewed. It might be assumed that these subjects were the casualties of the government’s views on the curriculum.

The small changes in mathematics and physics, no doubt owe something to the generous bursary and scholarships that have been available to trainee teachers in these subjects.

As noted, part of the change was due to the rise in school rolls. Generally, the Pupil Teacher Ratio in secondary schools has worsened as rolls have risen. This is not surprising. Governments have rarely been able to fully fund bulges in school populations. I suspect that part of the strain has also been felt in the size of ‘option groups’ in Years 10 and 11. However, I also know that class sizes have also increased in Years 7-9, where most teaching is of whole classes.

The other interesting question that arises from the data is the amount of teaching undertaken by those with appropriate qualifications in the subject that they are teaching. Regular readers will know my views on the subject. Teachers should be certified for specific subjects, and receive ‘emergency’ certification if required to teach ‘out of their field’.  The present system allows parents to be blissfully ignorant of whether their offspring are being taught by a teacher with either a degree and training in the subject or some lesser qualification. I wish more parents would ask. It would also be interesting to see research on GCSE results by the qualification of the teacher that taught the group.

With falling rolls, and reduced targets for trainees, we are entering a challenging period for those responsible for training teachers. I doubt the market will look like it does today in a couple of years’ time.  Who will survive and who will no longer be preparing graduates for teaching? Ans what of the alternative routes into the profession? Will they remain as at present? 

ITT Numbers for 2026 – brutal realism from DfE or big risk?

The DfE has today published its comprehensive analysis of the school workforce, including the trainee need for 2026/27 courses. As we know, pupil numbers are falling in the primary sector, and don’t have much further to rise in the secondary sector. As a result of this fact, added to improved take up of teaching as a career, and improved retention, the DfE has significantly adjusted its trainee targets. Teacher demand and postgraduate trainee need: 2026 to 2027 – GOV.UK

I will look at some of the data in more detail in future posts on this blog, but for this post it is just the changes in trainee needs.

Subject/phaseTRAINEE NEED 2021/22TRAINEE NEED 2025/26TRAINEE NEED 2026/27DIFF 26/27 ON 21/2226/27 0N 25/262025 ITT CENSUSNEW TARGET MET?
Art and Design5806806052575872YES
Biology8209856751453101489YES
Business Studies7259001200475300271NO
Chemistry108073069039040864YES
Classics406075351544NO
Computing840895565275330715YES
Design and Technology1475965620855345580POSSIBLY
Drama33062037040250255POSSIBLY
English19801,95019800302069YES
Geography745935685602501035YES
History780790520260270969YES
Mathematics28002,30020008003002588YES
Modern Foreign Languages15051,46010854203751364YES
Music540565260280305367YES
Others19802,520203555485348NO WAY
Physical Education1010725655355701466YES
Physics25301,41081017206001086YES
Religious Education47078045020330483YES
overall TOTAL3103026,92020800102306120
Secondary Total2023019,270152804950399016975
Primary Total108007,650552052802130

In the table I have ignored the primary phase. The total suggested of 5,520 for the postgraduate primary sector will no doubt cause real concern. However, as the DfE helpfully point out, these are not subject to recruitment controls.

In terms of the secondary sector subjects, it is worth pointing out that the DfE has seemingly abandoned the dubious practice of adding unfilled places from the previous year into the new need total. In its place, it has opted for a more nuanced approach. As I have pointed out before, schools start the term in September fully staff, so there are no vacancies, just teachers with sub-optimal qualification teaching pupils. Unless these teachers are sacked, there are no vacancies if too many teachers are trained.

In the final column, using the data from the 2025 ITT census, I have suggested my thoughts about the possible outcome of the current round based on these need numbers. More later

Falling rolls -who dictates the outcomes for schools: Parents or planners?

How do you deal with the issue of falling rolls in our schools? A senior politician recently told me that there was no way they would reduce the admission number for a successful school, because the parents wouldn’t stand for it.

Interestingly when Mrs Thatcher widened the concept of parental choice in section 6 of the 1980 Education Act, the civil servants left a ‘get out’ clause allowing local authorities to override their ‘duty to meet the expressed parental preference’ because it was ‘prejudicial to the efficient use of resources’.  Back in those days, the notion of parental power was very much in its early days.

Now the politician I spoke with was only voicing the approach any retailer might take to falling sales; cut out the loss-making branches and strengthen those that make a profit. ‘Let the weakest go to the wall’, a dictum many learnt in school when studying their Skaespeare.

But, should public services operate in the same fashion? It’s worth remembering that parents are required to educate their children, and the State is the default provision for those that don’t, won’t or in most cases cannot do so in any other way.

How the State has responded to that demand from parents for schooling has changed over time. A reader reminded me of the Liberal Democrat position, as expressed by Nick Clegg during the coalition government that perhaps took parent power to the ultimate. I wrote then a blog post entitled Private education, but State Funded? | John Howson This might have been a good idea at the start of a decade of rising school rolls, but does it hold good when rolls are falling?

I guess it depends upon where you live. In a densely packed urban area, with many schools within easy distance of each other, survival of the fittest might seem logical even if the fittest was a Church School and didn’t have many pupils on free School Meals.  However, even in urban areas, change is rarely easy, and often messy, and the current funding formula for schools doesn’t help.

Schools below capacity often run at a deficit, so should academy trusts prop these schools up with cash from other schools that don’t spend all their income?  Perhaps that’s why parent power – or at least parent governors – don’t exist in most academies, in case they rumbled what was happening.

In less urban areas, the issue is more complex. Consider the following case study. Imagine a town and its locality with 5 primary schools where there is little or no house building, and post-covid relatively little movement in the housing market. The current position for one such town

is shown in the table below.

In total, the five schools had 857 pupils on roll, but with a capacity for 1141, so were operating at 75% capacity. Intake for the latest year was lower at 66% of capacity.

 TYPECURRENT ROLLCAPACITY% CAPACITYPlaces offered – latest
SCHOOL 1RC1182105613/30
SCHOOL 2CofE2993159545/45
SCHOOL 3COMMUNITY1782108516/30
SCHOOL 4ACADEMY1301966615/30
SCHOOL 5COMMUNITY1322106318/28

Schools 1-3 are in the town, and schools 4-5 are within easy travelling distance. The obvious answer might be to close one of schools 4-5, but that would create additional transport costs for the local authority; to be paid from Council Tax.

Closing the RC school is not possible, as the exiting pupils cannot be accommodated at the other two schools, as they have insufficient spare capacity, and the need would be for an additional 70 places over the current capacity. Should the RC school numbers fall further to less than 100-110, and intakes not increase at the other two town schools, it would be possible to close the RC school if each of the other two schools in the town could take an extra class. However, the restricted nature of their sites may that possibility unlikely.

What happens if the RC school remains open, and starts to run a deficit budget and, as a consequence, either the diocese eventually decided to turn the school into an academy or it is judged inadequate by ofsted, and forced to become an academy. Could the diocese transfer funds from other schools to keep the school open?

What of the future for schools 4 & 5 if they are faced with the same scenario of starting to operate on deficit budgets, and the risk to the local authority with regard to school 5 at a time of great pressure on the authority’s budget.

Should someone create a plan for the future. If so, who? The local authority, the Regional School Director, the DfE? Or does the desire of the parents for one particular school eventually affect the other four schools, and the market decides? Discuss.

For those that want to consider the issue further, I wrote a play around a school facing falling rolls in its locality to try to tease out some of the issues. You can access it at C:\Users\dataf\OneDrive\Documents\FallingRollsPlay.docx or by requesting a copy by using the comment section

Reader might also like this post from a decade ago. My concern about the future of small schools isn’t new. Are small schools doomed? | John Howson

Free School Meals and headteacher vacancies

This is the third in my series of posts based upon my thoughts on headteacher vacancies that have been posted by state schools in England so far this school year. This post is a bit more speculative than the previous two posts, as it looks at the relationship between re-advertisements of headteacher vacancies and the percentage of children on Free School Meals as recorded on the DfE’s website in the schools that have re-advertised their headship.

I have used data for all the vacancies where free school meals data are available as the baseline. New schools; nursery schools; sixth form colleges and some other schools are excluded as they don’t have free school meals pupils. Thes other schools may be small schools, or just schools that have not recorded the percentage at this point in time.

% RANGE of FSM pupilsALL ADVERTSRE-ADSPERCENTAGE
0-9.91742414%
10-19.92672710%
20-29.91933016%
30-39.91632717%
40-49.91091514%
50-59.973811%
60-69.938411%
70+16638%

I have divided the vacancies into groups in an arbitrary manner. At this stage of the year, many schools that have advertised during February and March will not yet have had time to complete the appointment process, and decide whether or not to make an appointment or to re-advertise. As a result, the data presented in the table are in no way definitive of the current recruitment round. It will not be until January 2027, when the autumn term of 2026 re-advertisements have been added that a definitive report can be produced.

However, it is interesting to see that six of the 16 schools with the highest percentages of children with Free School Meals entitlement have already re-advertised the vacancy for their headship.

What I have yet to do is to look at the national total number of schools in each band, to see whether certain bands have a higher turnover overall. However, there are so many different possible intervening variables that such an exercise will need to wait until the end of the school-year, and possibly the autumn to be worth considering.

Nevertheless, as previous posts have made clear, there are some school types that are likely to have a higher rate of re-advertisement than others, and it will be interesting to see by the end of the recruitment round whether or not there is any correlation within groupings such as, for instance, Roman Catholic Schools in the North West of England or small primary schools in coastal areas and the free school meal percentage of schools that re-advertise their headship.

Is this data of any use to policymakers, and if so, what should be the outcome. In the past, during the coalition government there were suggestions for intervention in helping challenging schools recruit new leaders. Nowadays, I assume that is left to multi-academy trusts and diocese, and those local authorities that still take an interest in schooling to intervene. The other interesting question is, do schools with high levels of free school meals pupils retain headteacher for shorter periods of time than other schools?

Is there a leadership crisis in England’s state schools?

First, a health warning: the percentages of schools re-advertising a head teacher vacancy reported in this post will probably not be the final figure by the end of the current school year. This is because the 289 first advertisements recorded during March 2026 have yet to contribute any re-advertisements to the total.

The data for this post are collected from both the DfE vacancy site and other key job boards twice a week, and entered by myself into the database. A re-advertisement is recorded for any headteacher vacancy re-appearing with a new closing date more than 14 days after the original closing date. This allows two weeks leeway for short-term extensions of the closing date to be ignored.

I reported on the initial outcomes for the first 1,000 vacancies in a post on the 8th March What the first 1,000 headteacher adverts tell us | John Howson so this is by way of an Easter catch-up.

The database now has details of 1,261 advertisements for headteacher vacancies, posted by 1,110 schools.

The current re-advertisement rate for special schools stands at 27%. This is down two points from the 27% recorded in the 8th March post. However, it is still significantly higher than any other re-advertisement rate for a sub-set of schools: the current overall re-advertisement rate for all schools is 12% of all advertisement or 14% of first advertisements. This latter percentage reflects the fact that a small number of schools have now re-advertised their vacancy more than once. In March the percentage of all adverts that were re-adverts was 11%, so on that basis, at 12%, the overall position has worsened slightly.

As reported in the 8th March post, faith schools are more likely to appear in the list of schools that didn’t fill their headteacher vacancy at their first attempt. Based on a percentage of all adverts for the faith group, Roman Catholic schools’ re-advertisement rate currently stands at 19%, compared with 16% in the 8th march post. If re-advertisements as a percentage of schools advertising is considered, rather than the percentage of all advertisement, the re-advertisement rate for Roman Catholic schools, including the three schools that have re-advertised twice, rises to 23%. For Church of England schools, the percentages are 13% and 15%., just one percentage point above the average for all schools.

So, is there a crisis in headteacher recruitment? As my post of yesterday (3rd April) revealed, headteacher turnover is nowhere near the levels I recorded twenty years ago, so the volume of vacancies cannot be a reason for the current level of re-advertisements.

The mix of schools has no doubt contributed to the current level of re-advertisement by schools failing to make an appointment for their new headteacher or, in a few cases, co-headteacher on a job share.

I am wary of declaring a crisis at this stage of the year. Those that have read my book* of the 2013 blog posts know that when I called the teacher supply crisis in the early summer of that year, the DfE accused me of scaremongering. I would hate to be accused of such behaviour once more, so let me end by saying that the fate of pupils with SEND in special schools will not be helped if such schools cannot recruit headteachers.

I propose to write an interim report on the outcome for the year during August and the final version, allowing for re-advertisements during the autumn term will hopefully appear in January 2027.

*Teachers, schools and views on Education – available through amazon or on request directly from myself/

What’s in a name?

I was recently surprised to find that a school called John Spence Community High School in North Shields was in really an academy. I am sure the school serves its community, but I wondered how common is it for schools that are academies to use the term ‘community in their name? Well, there is Barnhill Community High School in Hillingdon, part of the Middlesex Learning Trust – itself a name that represent little more than the name of a county council abolished in the 1960s. There is also the Abbeywood Community School’ part of the Olympus Academy Trust in the Bristol area.

So, it seems that is not uncommon for schools to retain their existing name when converting to an academy. Other confusing names for schools that might catch out unwary parents, and even employers reading references include – grammar schools that aren’t selective schools – Enfield Grammar school springs to mind, but it is not alone. Indeed, Enfield is also the home of Enfield County School, located in Enfield that was once part of the county of Middlesex, and a selective school for girls while a Middlesex County Council School.  Again, it is not the only school to retain the term ‘county’ in its name. At least the ‘county’ schools in Essex and Surrey can at present claim to be part of a county. Post-local government reorganisation means that they will eventually join Enfield and Edmonton County Schools as representing areas that no longer exist in any local government sense.

High School is another meaningless term for a school. Such schools can be 11-16 or 11-18, selective or comprehensive, depending on where they are located. Even more confusing to anyone moving to the Derby area could be Risley Lower Grammar CE (VC) Primary School. What on earth is a ‘lower grammar school’? Like First school, lower schools are usually school taking pupils up to the ages of eight or nine, when they are not the used to describe a site for the first few year groups of a secondary school, or even, in the case of The Basildon Lower Academy in Essex, a school for pupils in Years 7-9.

If school types are confusing, then hopefully one can assume that all schools named after saints are church schools. Sadly, no. One of my favourite exceptions is a primary school in Watford. The school’s prospectus tell parents how the school acquired its name as follows:

St Meryl School was built in 1951 and is situated on a large attractive site in a central position within Carpenders Park. The name of the school, St Meryl, does not indicate any affiliation with a particular religion or religious denomination; in fact, “Meryl” was the name of the builder’s wife!” st-meryl-school-prospectus-2025-2026.pdf

I made use of this idea when naming he school in my recent play about falling rolls.

However, it is now the name of schools that worries me most, but that the term ‘teacher’ is not a reserved occupation term like ‘engineer’ or ‘accountant’. Anyone can call themselves a teacher, regardless of whether they have any qualifications.

To me that is an insult to the many thousands of teachers that gave gained QTS, often at great personal expense. There is still time to insert a clause in the Bill before parliament to remedy this oversight and grant legal status for qualified teachers.