More thoughts on the ITT round for 2026

Yesterday, although a bank holiday in England, more people listed as from the United Kingdom than listed as from the United States viewed this blog. It’s been a while since that has happened.

I guess it was because of the post about the May ITT numbers I posted yesterday. Yesterday also looks like a bank holiday that higher education ignores. I am not surprised as there can be too many bank holidays on Mondays in May, and that fact can play havoc with timetabling.

Anyway, thanks for viewing, as, wherever you are from, your support is much appreciated.

After producing my prediction table in yesterday’s post MayDay for some ITT subjects: joy for others? | John Howson

I thought that I would delve a bit more deeply into possible outcomes. Looking at 2025 data between May and September, and ignoring all applicants not from England, there were 11,773 more candidates in 2024 and 13,387 more candidates recorded in 2025 between May and September.

At 18th May 2026, there were 33,344 candidates, so it seems likely that candidate numbers will be up on the past two years in terms of candidates from England. However, as this also contains candidates for the primary sector, that factor needs to be taken into account. This year, with a low ‘target’ for primary, I would be surprised to see many more candidates applying for primary sector courses, as most courses will presumably be showing as ‘full’.  

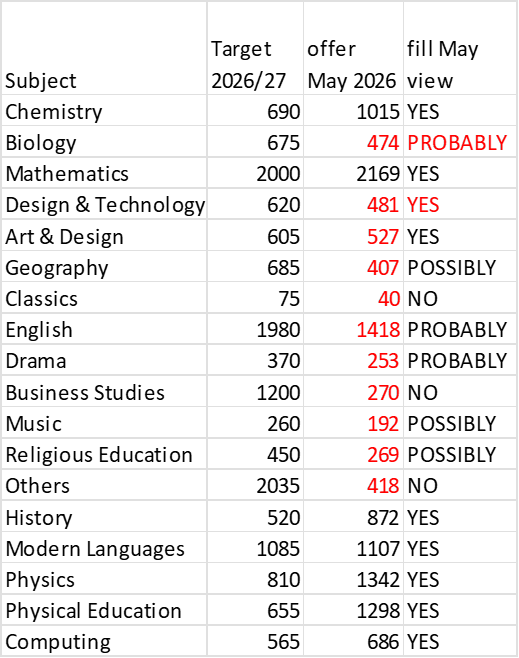
However, what about the subjects listed as anything other than ‘Yes’ will fill in the previous table? How do they fare?

The following table is based upon ‘offers’ not ‘candidates’ numbers between May and September for 2025.

subjectMay-25Sep-25difference% increase offers May to September
Others4185008220%
Classics44541023%
Physical Education1395177538027%
History832113230036%
Physics1246169845236%
Mathematics2169314297345%
Religious Education34750816146%
English1467216169447%
Drama23434911549%
Music27641614051%
Art & Design709108637753%
Business Studies21232911755%
Geography731113540455%
Modern Languages1089170962057%
Biology1094173363958%
Chemistry682109140960%
Design & Technology46678331768%
Computing53794240575%
  
Total Secondary1353020043651348%

There is no doubt that had the DfE output from the Teacher Supply Model remained the same as I 2025, this table might have looked very different.

I think that I might upgrade Geography from ‘possibly’ to probably’ on this data. As music had a bursary last year, I am not yet prepared to upgrade that subject to ‘probably’, at least until after July numbers, and the applications from 2026 graduates have been taken into account. The same is true for Religious Education.

Another area of uncertainty remains around the sciences. The total target had been reached by the end of May, but biology numbers were below target. Will providers top up with students to make courses viable? My guess is, yes, as there seems to be no penalty to the provider for doing so. The risk is all carried by the trainee.

In the future, I think that the DfE needs to consider disaggregating the 2,035 places listed as for ‘other’ subjects. Not to do so makes the data increasingly meaningless, especially once the fact that more than a third of applicants come from outside of England is also taken into account.

Finally, as we know for the annual DfE’s ITT census, not all offers turn into students counted in the census. I might try and look at what level of over-recruitment might be sensible to ensure 100% of the DfE’s target by the time of the ITT census, after allowing for the fact the TSM target should include a percentage of in-course wastage.

Afterall, the aim is to ensure the labour market has the qualified teachers it needs for all students to be taught by properly qualified teachers.  

Higher Education: markets v planning for the sector

I don’t often write about higher education, as, although I spent more than a decade running a large department in a university, and also writing about activity-based costings in higher education, I don’t consider myself well enough briefed to comment regularly.

There are exceptions to my self-imposed rule, and this post is one of those. What persuaded me to write this post was a link to this article Universities on the brink: Decoding the UK higher education funding crisis and the path forward | The Educationist

Now, for most of this century, and indeed the last decade of the previous century, higher education providers have been free to operate in a market, with limited government intervention, except in areas such as teacher education, and providing courses for both doctors and the professions allied to medicine.

As I discovered when running courses for new heads of departments in universities about how higher education funding worked, most academics had limited knowledge and often less interest in the subject when asked to take on running department: at that time; even Deans were often more interested in course quality than the financial health of the departments they headed.

Regardless of the reasons behind the current financial malaise, should the market be left to bring the sector back to financial equilibrium? Of course, the government could just throw money at the problem, but I guess it hasn’t the funds, and anyway, the DfE might put NEETs and SEND above bailing out universities in any priority list.

However, I don’t think the government should leave everything to the market. After all, it is the largest consumer of graduates: 30,000 teachers per year to be trained; NHS staff; the defence forces; the civil service and local government. These are all consumers of graduates in large numbers.

Allowing the market to solve the financial problems might have unintended consequences. A major concern for me is around the mobility of new graduates. Many years ago, I studied where trainee teachers went to study, and there was a correlation between where a first degree or higher-level courses was studied, and where individuals entered teacher preparation courses. Universities without schools of education provided fewer recruits to teaching.

Well, Teach First helped solve that problem, at least in London, but I am concerned that market driven course closures could leave parts of the country without degree courses in some subject areas vital for the public sector.

For this reason alone, I think the government should ensure some form of course planning for the higher education sector, so that there are not areas without say, music courses or philosophy. Both are degree courses important as part of the pipeline for future teachers of music and religious education. As these are also both subjects that already fail to recruit enough graduates into teaching, reducing the number studying them on degree courses even further would endanger that pipeline even more.

The intervention of the government in place planning, even at a broad level, also makes economic sense to me, as moving students from loans to welfare is also not a good use of public money. How to manage the balance between leaving the future for higher education to the market, and an orderly return to fiscal rectitude might at least be worth a discussion amongst politicians and those that advise them.

UCET’s changing of leadership: a rare event

I have been rather tardy in posting my appreciation of the work of James Noble-Rogers, as executive director of UCET (The Universities Council for the Education of Teachers). James was only the second Executive Director the organisation has had so far, taking over from Mary Russell, its first director, after she had presided over the coming together of UCET and PCET, the universities high education teacher training organisation that merged with the polytechnics and colleges organisation, after those institutions became universities in the 1990s to form UCET as it is currently constructed.

James was recruited to his post at UCET from the civil service. I first knew him when I served at the then Teacher Training Agency between 1996 and 1997, in the role of advisor on teacher supply, an interest I retain until this day. James was working on ITT numbers in the DfE, and was a natural fit to take over from Mayr on her retirement. However, I suspect that many were surprised to see a civil servant, and not an academic, appointed to the role. Appointing James was an inspired move.

Afte leaving the TTA in 1997, I worked closely with UCET, and James, for about a decade while he steered UCET through the problems of firstly, falling interest in teaching as a career, and then the boom after the 2008 economic crisis that lead to, in my view, the mis-guided decision by Ministers to axe the training grant and require the payment of tuition fees for graduates when Michael Gove became Secretary of State. These moves contributed to the teacher supply crisis that I foreshadowed on this blog in my 2013 posts (see Howson: Teachers, Schools and views on Education – available from Amazon as an eBook).

The early years of the coalition were a challenging time for colleagues working higher education preparing new teachers and providing INSET. Some will recall the ‘blob’; others, the issue of recruitment controls that nearly caused several universities to consider pulling out of ITT/ITE.

James remained resolute in supporting the higher education community’s central involvement in teacher preparation and development, the position it still holds today, while recognising the emerging partnership with schools that through SCITTS were providing their own version of teacher preparation. At the same time, Teach First was creating another route into teaching.

The last decade after 2016, brought new changes, the effect of the covid pandemic, plunging interest in teaching from home students and the growth, in recent years, of applicants from around the world.

As I became more involved in local government politics after 2013, I lost regular contact with UCET, and stooped attending their annual conference.

Even to, I am delighted to be able to recall my association with James, and the long service he rendered to UCT over more than a quarter of a century. I hope that as with his predecessor, his work will be acknowledged formally by the State.

I enjoyed the time when I worked with James, and wish him well in the next stage of his life. I am delighted to see that he is still offering his support, advice and knowledge that few others can rival.

Discipline in schools – the latest data around suspensions and exclusions in one area

Now that the local elections are out of the way, it is time to consider other issues – However, I might blog about my thoughts about schooling when all the results have been published and considered.

Earlier this week the DfE published data for exclusion and suspensions by schools for the spring term 202425; i.e. last year. The data came along with time series data for spring terms back to before the covid pandemic, indeed, starting in 2016-2017 school-year; the spring of 2017. Create your own tables on suspensions and permanent exclusions in england – Explore education statistics – GOV.UK

It is worth recalling that during the period under review by the DfE school rolls across the secondary sector have been on the increase, mostly as a result of the earlier rise in the birthrate. Some areas, including the one under consideration have also experienced a significant housebuilding boom for most of the period under review. New housing usually means more pupils.

I looked at the data for both suspensions and exclusions for all the secondary schools in one current local authority area. All but one school are currently academies, and most have been for the whole of the time period. Some schools have changed academy trusts during the time period, and three new schools have opened during the period, and one 14-18 school has closed.

The schools already had noticeable numbers of suspensions before the covid pandemic. Since then, the numbers each year have been much higher, than before the pandemic, as shown in the chart.

The last three years for which data are available witness record numbers of suspensions, although not all schools have increased suspensions at the same rate. The range in the spring term 202425 was from one school with just 6 suspensions, to another with 291, albeit, this was one of the largest schools in the authority. However, it was not an urban school. Eight schools each recorded more than 100 suspensions in the spring term of 202425.

The picture for exclusions is much more encouraging, as can be seen on the following chart. This uses a logarithmic scale to plot both suspensions and exclusions. Exclusions across the authority have rarely exceeded ten in a spring term.

Of course, the total of suspensions for any one school can include multiple suspensions for the same pupil. The length of the spring term can also be affected by the changing date of Easter each year. This factor might have a small effect on each year’s data.

Of course, some pupils may not be ‘excluded’ at all, and hence not feature in these charts, but may be voluntarily removed to ‘home schooling’ by their parents. Whatever happens to pupils suspended or excluded, not being in school is more likely to see them become involved in a life of crime, often more serious crime than if they were in school on a regular basis.

Do some academy trusts have higher rates of suspension than other trusts among their schools? This is a challenging question to answer because it is clear that there is more likely to be a relationship between suspensions and the IDACI group in which the schools sits than the nature of the controlling MAT. However, it is clear than becoming an academy is not a panacea for solving the discipline issue of a school; at least as far as academies in this authority are concerned.  

Are suspension rates now on the way down? I hope so, but an not yet convinced that is the direction of travel. Time will tell.

David Attenborough at 100

This week the BBC has being paying tribute to Sir David Attenborough, ahead of his 100th birthday later this month. There is no doubting that Sir David has had a great deal of influence on many people through his television documentaries, at first in shades of grey, and then in colours that have improved as television screens have become ever more sophisticated in replicating the colours of the real world.

But who influenced Sir David Attenborough in his choice of career? Way back in 1997, the then Teacher Training Agency decided to commission two cinema advertisements. One, that received all the attention was called ‘talking heads’, and featured head and shoulder shots of a range of celebrities just saying a name to the camera. The trap line at the end was ‘no one forgets a good teacher’.

The other, far less well-known advertisement commissioned by the Teacher Training Agency in 1997 featured a teacher called Horace Lacey and a pupil called David Attenborough. You can see it here. Teacher Training Commercial: Horace Lacey | Catalogue | History of Advertising Trust My thanks to the History of Advertising Trust.

Both adverts were placed in cinemas, and because it was before the general use of websites and urls, postcards were placed in cinema foyers to provide the contact details for anyone interested in teaching. After all, it was impossible to write down a phone number in the dark of a cinema at the time when the advert was actually being played.

At the same time, the agency produced a famous poster with the stap line ‘the dog ate my homework. a phrase that passed into common parlance for a period of time.

After a few years, advertisements for teaching as a career started to reappear on TV screens, albeit at the wrong time of year to make any significant short-term difference to recruitment. I made an oblique comment about the effects of TV advertising in this post Do TV adverts work? | John Howson However, I am afraid the title is a bit of a misnomer.

So, my very best wishes to Sir David Attenborough. I hope that all the publicity surrounding his 100th birthday will help inspire the next generation of young people, and the present generation of undergraduates, to take up teaching as a career.  I also hope that the attention to Sir David’s birthday also encourages us to honour the memory of Horace Lacy, and countless hundreds of thousands of other teachers like him that have inspired their pupils down the generations.

Thank a teacher, it is an inspiring job that is like no other. And, although I may not have inspired many of my pupils, I did recognise those around me, both in school and higher education that changed lives and careers. My personal thanks to them.

Labour market for music teachers: update to end of April 2026

Regular readers will know that I am tracking two parts of the labour market for teachers in state schools across England during the 2025-26 school-year: vacancies for headteachers and vacancies for teachers and middle leaders of music.

Regular readers of this blog will also know that one of the reasons that I selected music as my subject to track was the government’s removal of the training bursary for those applying for postgraduate teacher preparation courses starting in the autumn of 2026.

By tracking vacancies this year, I have a baseline for next year, if, as seems likely, the removal of the bursary reduces interest in teaching music. However, the government has also slashed its published number of trainees needed – see ITT Offers – public money being wasted? | John Howson and my more recent post on the situation after the report on April offers was published.

Anyway, back to the update on published vacancies for teachers of music, and how these vacancies compare with the expected output from this year’s preparation courses.

By the end of April, I had recorded some 389 vacancies for teachers of music. 86 of these were for promoted posts, with an allowance attached. It could be assumed that these vacancies were not intended for teachers straight out of their preparation courses. However, in some smaller secondary schools, this might be the only full—time post and include responsibility for choirs, orchestras and ensembles. However, for the purpose of this exercise, such posts have been eliminated.

After removing the promoted posts, this leaves some 303 vacancies suitable for new entrants into the teaching profession advertised between January and the end of April 2026.

The DfE’s ITT census recorded some 367 trainees on preparation courses in December 2025; mostly for entry into the labour market in September 2026. Assuming all 367 entered the labour market for teachers in state schools, there are still sufficient to fill another 64 vacancies.

However, we know that not all trainees last the courses, and of those that complete the course, not all start teaching in state schools. Some entre the private sector; some further education; some music services and some don’t enter teaching at all.

As a result, the chart shows the remaining trainees available if 10% and 20% of trainees aren’t available to state schools. This approach reduces the remaining number of trainees to little more than 50 trainees. With around 75 vacancies a month so far in 2026, if May’s vacancies follow the pattern of the first four months of 2026, then the remaining total of trainees will be exhausted before the end of May, and resignation deadline day.

Of course, not all basic vacancies are filled by new entrants from teacher preparation courses: some are filled by returners – we can ignore school switchers as we can assume that leaving one school to fill a similar vacancy at another school is neutral in terms of jobs. However, if the move is for promotion, the there is a new vacancy.

Returners would need to fill around 30% of vacancies across the whole year – they are generally the only source of teachers for January appointments, so for September it looks as if schools will struggle to fill any late appointment resulting from resignations close to the 31st May deadline.  However, the picture will be clearer at the time of next month’s update.

Finally, although I do not track vacancies posted by private schools, both in England and abroad, I do survey the market. Generally, this market has twice as many vacancies as posted in any one month by schools in England.

One wonders whether the current cohort of new graduates might have missed out on gap year travelling because of the after-shocks from the covid pandemic and might, therefore be more willing to teach overseas? This has the advantage of not losing income to student loan repayment, and the bursary isn’t repayable.

On the negative side, the conflict in the Middle East may well be deterring some teachers from working in that part of the world, and may have increased the number of returners once more seeking a teaching post in England. We shall see.

Are rainy day savings by schools affecting outcomes?

Is there any relationship between the reserves a school holds and the outcomes for its pupils? One thesis might be that schools that spend more of their revenue budgets, and don’t add to their reserves each year, do better for their pupils than those schools more concerned with ‘saving for a rainy day’ or adding to their reserves for some other reason. Of course, this thesis only really works with a funding model that funds schools appropriately. Nevertheless, it is question worth asking.

This post looks at the evidence around the relationship between the quoted reserves of the primary schools across three multi-academy trusts (MATs) of differing sizes. The schools are in a range of different locations, and have a range of pupil numbers, but are all located within the boundaries of a single local authority.

KS2 achievement Percentage %No of KS2 Pupils 24/25 reserves per KS2 pupil
4230 £        24,333
6916 £        16,313
6422 £        16,273
3625 £        14,480
2711 £        12,364
9111 £        12,249
4715 £        10,600
3429 £        10,172
6913 £        10,077
5016 £          9,375
5016 £          8,688
3327 £          7,667
5645 £          7,267
5648 £          6,896
6916 £          6,813
6939 £          6,692
9315 £          5,933
5831 £          5,484
8318 £          5,287
8211 £          5,091
7218 £          5,000
6531 £          4,258
5022 £          4,182
5531 £          4,129
4821 £          4,098
7359 £          3,847
5028 £          3,536
7315 £          3,467
7528 £          3,214
4827 £          3,111
7061 £          2,738
6758 £          2,535
9123 £          2,531
5657 £          2,509
8323 £          2,087
5944 £          1,864
7131 £          1,677
5770 £          1,614
9212 £          1,362
5260 £              950
7629 £              862
7260 £              700
5618 £              611
4529-£         1,655
8614-£         1,714
7919-£         2,474
5831-£         3,084
867-£         3,295
8938-£         4,756
5315-£         8,667
4825-£       11,040

The range of reserves, as taken from the reserves in the accounts filed at Companies House by the MAT, vary per KS2 pupil from a high of £24,333 per pupil, to £611 for schools with those schools with reserves. Eight schools are shown as having deficits

Leaving aside, at this point for schools with deficits, it is worth comparing the other schools in the table with the average outcome for all pupils in the local authority of 62%.

The schools in the table, are of different sizes. In the schools in the table the range of KS2 pupils extends from schools with just 11 KS2 pupils, to one with 70 KS2 pupils. Where a school has a stable intake, the KS2 reserves per pupil is easy to spread across the schools, although some schools still start pupils, at age 5, many at age 4 and a few even younger and with a nursery class, and this may make a difference to reserves.

In this era of falling rolls, allied to parental choice, some school’s KS2 numbers would overestimate the school population if grossed up across all year groups. For that reason, I have just used the KS2 pupil number for this exercise.

Six of the top 10 schools with the highest reserves per pupil had achievements below the local authority level of 62%. This compares with four of the ten schools with the lowest reserves (not with a deficit).

It is interesting to note that one MAT has 12 schools in the top 15 schools with the largest reserves per KS2 pupil, and 15 in the top 20 schools. Of the other two MATS, one has three schools in the top 20 schools by reserves per KS2 pupil, and the other just two schools.

I suspect that both these MATs more actively work with their schools than the other MAT in terms of making use of their cashflow. All the schools in this latter MAT in the top 20 by reserves are also well above average for performance levels. The position is more mixed for the other smaller MAT, but I suspect its policy is evolving as it has acquired more schools.

How much does parental choice, and falling rolls play a part in determining reserves? Certainly, primary schools that have no spare places across all year groups will do better with a funding model that is weighted towards pupil numbers than schools unable to make full classes even by mixing year groups together. In another post, I will look at school size and reserves.

It would be interesting to conduct this exercise across all schools in a local authority. However, pooling of reserves by some MATs, and a lack of visibility for the reserves of maintained and voluntary schools makes that task effectively impossible.

No doubt the DfE could ask the question about why there is so much difference in reserves per pupil between schools, and could ask if some schools could achieve more for their pupils if they kept less in their reserves? School governors, MAT trustees and the teacher associations, as well as local politicians, might also like to ask this question.

UK graduates not yet rushing into teaching

There has been a lot of talk about how challenging graduates are finding the job market at present. Is this ‘difficult’ job market for graduates showing up in renewed graduate interest in teaching as a career? The DfE has published the latest (April 2026) data about application to teacher preparation courses as a 20th April 2026. Initial teacher training application statistics for courses starting in the 2026 to 2027 academic year – Apply for teacher training – GOV.UK

While there has been a modest increase in applications to be a teacher for most areas of the United Kingdom – the North East, Northen Ireland and Wales excepted – the biggest increase continues to be from the ‘rest of the world’ grouping, up by a massive 42% on April 2025. Only three regions in England have percentage increases in double figures: the East Midlands, London and the North West. The South East, South West and Yorkshire and The Humber regions have increases in applicants of less than five per cent.

AreaApr-26Apr-25Difference% Diff
EM2427206236515%
EE283126302017%
LON6504571179312%
NE10681108-40-4%
NW4106359551112%
SE397538171584%
SW216720661015%
WM336231202427%
YH28082720883%
292482682924198%
  
EEA582528549%
NI447473-26-6%
RoW122517096515542%
SCOT20319673%
WALES384418-34-9%
UNKNOWN106120-14-13%
139738831514237%

Increases at this level do not yet suggest a significant switch to teaching in large numbers. Indeed, the increase in England as a whole is just 2,419 extra applicants, or 8%.

One significant increase is that of male applicants, up from 13,234 to 18,111. However, it is impossible to know how many of these extra male applicants have come from the ‘Rest of the world’ pool?

There are also large differences in the increases from ‘new 2026’ graduates and older graduate. However, the ‘Rest of the world’ effect may be skewing this data

AgeApr-26Apr-25Difference% Diff
21312629941324%
22425639682887%
23368233693139%
24282826132158%
25-29102877824246324%
30-3467634618214532%
35-3951443899124524%
40-443524286066419%
45-492012175625613%
50-54956919374%
55-59446455-9-2%
60-64158145138%
65+3733411%
unknown47-3-75%
4322335460776318%

Total applicants at 43,221 remains well below the record of 67,269 applicants for similar courses recorded by the UCAS GTTR scheme in the 2009/2010 round during the aftermath of the 2008 economic crisis. To that number must be added those that applied for school-based courses, such s the GTTP that did not recruit through UCAS, as well as the Open University, that also did not recruit through UCAS.

Higher Education – up from 24,028 to 30,104 has borne the brunt of the extra applications. SCITTs have shown little growth, up from 11,293 to 11,544, perhaps because overseas applicants are less familiar with this toute into teaching. This might also explain the lack of any increase in the ‘partner-led’ courses. Apprenticeships are on the increase, up from 4,783 to 7,894, but ‘salaried route remains static at 5,883 compared with 5,389 last year in April 2025.

Even before the DfE announcement of the ‘needs’ numbers for 2026, ‘offers were down at 20th April at 17,880, compared with 18,297 in April 2025.

I have written a separate post about the state of play with regard to ’offers’ in secondary subjects. In the primary phase, applicant numbers are up from 12,502 to 14,797, but ‘offers’ for primary courses are little changed, up from 6,992 to 7,106. However, as the DfE ‘need’ has reduced ‘need’ from 7,650 to just 5,520 for 2026, there are likely to be few if any more offers, as the ‘need’ figure is already some 1,500 below the ‘offer’ number.

So, there is no great rush towards teaching as a career from United Kingdom graduates. Whether that will change over the next couple of months as final examinations are completed, and the reality of the job market hits home, only time will tell. But, for would-be primary teachers, I expect that the  ‘bus has now left the stop’ and it was already fully laden.

Religious Education – the need for qualified teachers

In a recent post on this blog about the DfE’s modelling of trainee teacher needs, I wrote that

‘However, has this re-assessment of need gone too far? Based on … my own current research into vacancies for teachers of music, I think the DfE has been realistic in its approach. ‘

While, I stand by that judgement, I have also been reminded by Deborah Weston, championing on behalf of those concerned with the teaching of religious education in schools that the cutback in trainee numbers probably allows little room for the replacement of the ‘under’ or even ‘un-qualified’ teachers currently teaching religious education in our schools.

Prompted by Deborah, I looked at the trends from the Teacher Workforce surveys concerning the use of those with ‘no qualification in the subject’ teaching religious education over the period between the end of the Blair/Brown Labour government and the end of the Conservative period of government. Of course, recent years have been impacted by the covid pandemic, and its consequences, but there is a clear trend that is observable.

The chart shows the four key types of secondary schools, of which the 11-18 school line is probably the most significant.

At the end of the Labour government, partly I expect as a result of the economic crisis of 2008, the percentage of teachers of religious education with ‘no qualification in the subject’ was reducing. However, the percentage levelled out as school rolls began to increase again, and teacher supply entered into an extended period of years when teacher preparation programmes missed their targets.

There was a brief respite as a result of covid, but in the most recent years, as trainee numbers have fallen, so the percentage of teachers with ‘no qualification in the subject’ has reached levels not seen since well before 2010.

As a result, the question now is, was the DfE right to cut trainee targets for religious education from 780 last year to 450 this year? On the basis that including unfilled places from previous recruitment rounds was a mistake, as I have always maintained, then the answer is clearly, yes, the DfE have taken the correct decision.

However, in subjects such as religious education, where most pupils only study the subject for a limited period of time each week, managing recruitment is easier for schools, if qualified staff are available.

I would add that in my opinion, religious education when taught by well-prepared and knowledgeable teachers can be a really valuable subject, especially at this time in the history of our multi-cultural society, where both many different faiths are practiced, and a growing minority profess to having no faith in religion at all.

If the government cannot see their way to increase the stated need for trainee religious education teachers, providers can always over-recruit, at least to higher education courses, where government funding isn’t an issue.

In addition to pre-entry training, the DfE might also like to consider another approach to the issue of shortage of religious education teachers: upskilling those presently teaching the subject, but without an appropriate qualification.  If it is important that a subject be offered on the curriculum, it beholds government to ensure it is taught properly.  

Spending cash on upskilling will no doubt help retention, and thus save on recruitment and training costs. However, apart from in mathematics and the sciences, it hasn’t really featured as a policy objective for many years: surely that’s a mistake.

I hope that the religious affairs lobby is able to persuade the government that significantly reducing the percentage of inappropriately qualified teachers of religious education should be a key policy objective.

ITT Offers – public money being wasted?

The DfE has today published the April data on postgraduate ITT courses, as at 20th April 2026. Initial teacher training application statistics for courses starting in the 2026 to 2027 academic year – Apply for teacher training – GOV.UK

This is the first month where offers can be compared with the DfE’s required need for each subject for September 2026 courses. I have previously posted about the draconian changes to the demand in many subjects as required by the DfE that have resulted from a different approach to unfilled vacancies. ITT Numbers for 2026 – brutal realism from DfE or big risk? | John Howson

Here is my assessment of possible outcomes for September, when courses commence, based upon current offers and past trends. It will be interesting to see how my view compares with that of Jack Worth at NfER.

SubjectTarget 2026/27offer April 2026DfE identified needFILL?
Chemistry690829-139YES
Biology675398277YES
Mathematics20001752248YES
Design & Technology620382238POSSIBLY
Art & Design605449156YES
Geography685353332POSSIBLY
Classics753639NO
English19801176804PROBABLY
Drama370207163PROBABLY
Business Studies1200224976NO
Music26016199POSSIBLY
Religious Education450339111POSSIBLY
Others20353721663NO
History520736-216YES
Modern Languages1085946139YES
Physics8101140-330YES
Physical Education6551175-520YES
Computing56553926YES

In some subjects, such as history, physics!, physical education and chemistry, providers have already made more offers than required ‘need’.  This demonstrates the danger of leaving it so late in the recruitment cycle to announce estimated demand.

In the past, these numbers used to appear before Christmas. With a rolling offer system in place, rather than a defined closing date, leaving the announcement of ‘need’ until April is likely to cost someone money. Will the DfE pay bursaries to all students offered a place, even if recruitment is above the stated ‘need’? If so, that could be seen as a waste of money.

However, of more concern are the subjects where, even with the new numbers for ‘need’, there are unlikely to be enough applicants to fill all the places. Based on previous trends, classics, business studies and the ’others’ grouping will not meet their ‘need’ number. I think it is time that the ‘other’ category, with 2,035 places is disaggregated into different subjects, after all, it is now by far the largest group in the subject’s table.

I have some concern about where design and technology, geography, music and religious education will produce enough offers to meet the revised ‘need’. However, I can now see why the bursary was removed from music. I still think that was a serious error of judgement, as this is a subject where only those with appropriate subject knowledge are accepted onto courses. Music has one of the highest applications to offer ratios of any subject. Current offers are the second lowest April ‘offer’ number since 2018.

What happens in the wider economy, and graduate job market, will determine the outcome of this recruitment round. I suspect there will be a summer surge in applications, as new graduates discover how tough the job market has become. This should mean a good year for teaching course. However, many applicants may now have found they have left it too late to secure a place for this autumn. This year will really be a case of ‘the early bird that catches the worm’.

I will now delve deeper into the data for another post about the nature of applicants and applications as revealed in this month’s data.