It’s the numbers not the percentages that matter most

Each year, the DfE publishes details about the workforce in schools. The data about teacher numbers are collected in the School Workforce Survey, conducted every November.

Included in the data are details about teacher retention in state funded schools. Interestingly, although the DfE provided the actual number of NQTs each year, the retention data is shown as a percentage of that base number. Release home – School workforce in England – Explore education statistics – GOV.UK as demonstrated in the following table.

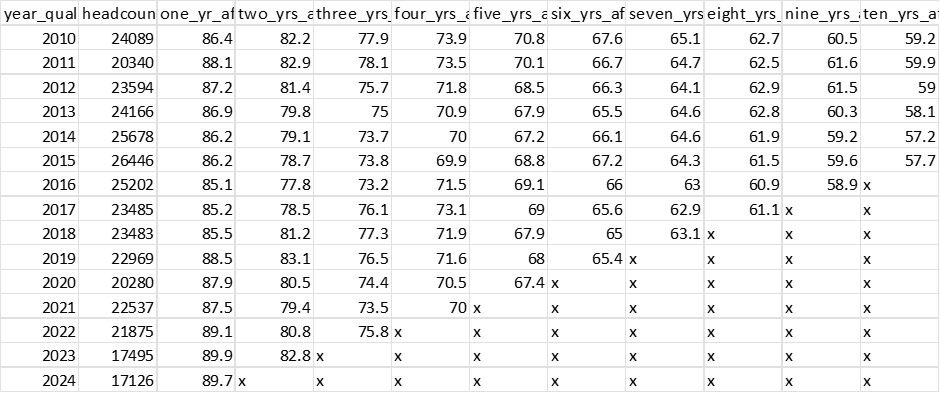
The picture is obvious, despite some late arrivals after qualifying, the percentage falls for each extra year of service, so that of the 2010 cohort, only 59.2% were still in service after 10 years.

 Over the past few years, the percentage in service after one year has fluctuated from a low of 85.1 for the 2016 cohort to a high of 89.9 for 2023 cohort, with the 2024 cohort still doing well, with a retention rate of 89.7% at year 2. This looks like good news for the government.

However, there is less good news for the cohort that joined during covid in 2020 and 2012. For these two cohorts, retention after four and five years is poor, and back to levels last seen in 2014 for the 2021 cohort.

So, good news, retention is improving. Might the government even meet its target of of 6,500 extra teachers? Now it is time to change the percentages into numbers.

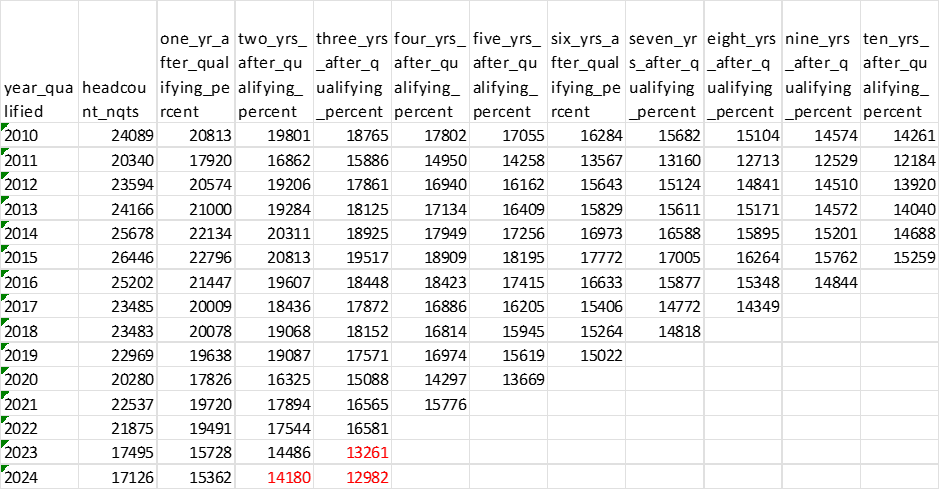
Here the picture is different. I have projected an extra year for the 2024 cohort and two years for the 2023 cohort just to show what might happen. The behaviour of those two cohorts is very important as they represent the lowest intakes of NQTs since 2010. Sadly, the government doesn’t publish the table by sectors. This is important because it is the key secondary subjects that already start with shortages where retention really matters for the performance of the school system, and especially for the outcomes for children in schools with high percentages of pupils on Free School Meals.

The current ten-year loss numbers show a worrying trend.

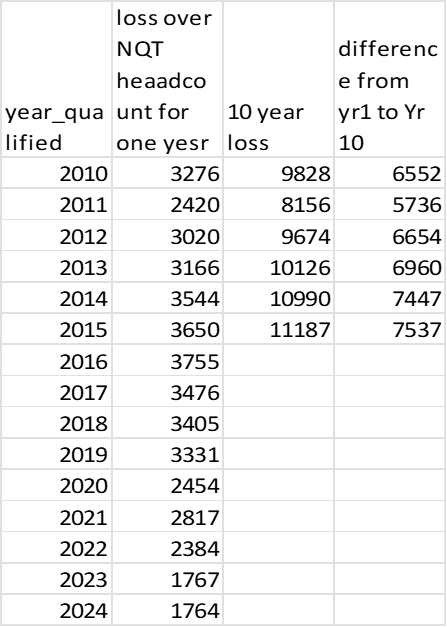
Hopefully, this loss of experienced teachers will reduce over the next few years, as the cohorts following the 2015 cohort have better retention numbers and percentages. The real concern is the 2020 and 2021 cohorts.

However, with falling rolls, starting to appear in the secondary sector, and already seriously affecting the primary sector in London, the retention rates for teachers may well improve, if schools can continue to afford the same number of teachers.

As my previous posts have made clear, the relationship between the National Funding Formula and pupil numbers will be crucial to future size of the teaching force. Falling Rolls: Is the funding formula making matters worse? | John Howson

When is a pledge not a pledge?

When is a pledge not a pledge? Change Labour Party Manifesto 2024

The headline in Labour’s 2024 General Election Manifesto said:

“Recruit 6,500 new teachers in key subjects to prepare children for life, work and the future, paid for by ending tax breaks for private schools.”

Note, nothing about lecturers and further education, and key subjects weren’t defined

In the text of the manifesto the promise or pledge was slightly different. The commitment was to recruit an additional 6,500 new expert teachers. Again, no mention of lecturers and further education and ‘key subjects’ didn’t appear, but ‘shortage subjects’ did. Page 82

“The factor that makes the biggest difference to a child’s education is high-quality teaching; but there are shortages of qualified teachers across the country. Labour will recruit an additional 6,500 new expert teachers. We will get more teachers into shortage subjects, support areas that face recruitment challenges, and tackle retention issues. The way bursaries are allocated, and the structure of retention payments, will be reviewed.”

Interestingly, there was also mention of ‘support areas that face recruitment challenges, and tackle retention issues.’

In the review of the 2025 Workforce, the DfE comment that

“The government, in its opportunity mission, has set a pledge to recruit 6,500 additional teachers. Further information on this ambition can be found in the 6,500 additional teachers delivery plan (opens in new tab). Latest figures show an increase of 3,000 secondary and special teachers since 2023/24 which contributes to this target. Combined statistics across schools and further education show an increase of 4,654 against this 6,500 target.” Release home – School workforce in England – Explore education statistics – GOV.UK

There doesn’t seem to be any mention of how these additional teachers ‘support areas that face recruitment challenges, and tackle retention issues.’  According to the DfE, The pledge is for mainstream secondary schools, special schools, further education (FE) colleges, and FE school based providers; it does not include primary schools. Latest figures show an increase of 3,000 secondary and special teachers since 2023/24 which contributes to this target.

However, much of the increase may well be down to improved retention rather than increased recruitment. Sadly, the headcount for both physics and chemistry teachers for all years 7-13 are still below the 2020/21 figure

Physics

2020/21 6,693

2024/25 6,465

2025/26 6,127

Chemistry

Physics

2020/21 5,886

2024/25 5,602

2025/26 5,357

So, there must be some questions to ask about the number of teachers in these subjects, and the aim to ‘get more teachers into shortage subjects’.

Still, perhaps the percentage of hours taught by those with qualifications has increased. Sadly, not since 2020/21

Percentage of hours taught by teachers with qualification for ‘Subjects taught and Specialist teachers and hours’ for 7 to 13

Chemistry

2020/21 48.9%

2024/25 45.7%

2025/26 44/7%

Physics

2020/21 45.2%

2024/25 42.8%

2025/26 41.2%

So, increased ITT numbers and better retention has yet to feed through to the teaching of physics and chemistry. Perhaps it is because of the way teaching in years 7-9 is arranged in most schools. What about teaching in sixth forms of Years 12 and 13?

Percentage of hours taught by teachers with qualification for ‘Subjects taught and Specialist teachers and hours’ for Years 12 to 13, Chemistry, PGCE, PGDE, ProfGCE, or ProfGDE, Physics and Qualified teacher in England between 2020/21 and 2025/26

Chemistry

2020/21 52.6%

2024/25 49.5%

2025/26 49.1%

Physics

2020/21 52.4%

2024/25 49.4%

2025/26 47.4%

I find this decrease disappointing.

Overall, there is some way to go to meet the manifesto wording, and with static rolls and funding for schools likely to be challenging, I wonder whether the proliferation of small sixth forms is helping or hindering the teaching of these subjects. Perhaps the DfE can identify whether there is any link between the sixth of sixth form groups and the qualifications of those teaching Years 12 and 13?

Mixed messages on teacher retention in latest data

How long do teachers stay in service? The DfE comment in their analysis of the latest data that Retention rates for teachers increased for both the newest teacher cohort who qualified in 2023 and for second year retention for those who qualified in 2022, while decreasing for most earlier cohorts compared to the equivalent measure last year.

Now after a period where retention rates have been declining that’s good news, and with the worsening general labour market and an older teacher workforce than in recent years, I expect retention rates to continue to improve over the next few years.

However, the improvement is something of a mixed blessing. Teachers with longer service tend to cost more, and if schools are funded for average salary costs, more schools will find the pay bill higher than the funding, especially as pupil numbers drop.

At the same time, higher retention rates mean fewer vacancies as rolls fall unless schools receive real increases in their funding that allows additional teachers to be recruited (the Spending Review will answer that question).

If past history is anything to go by, then different regions of the country will be affected differently. My guess is that retention rates will be lower in London and the Home Counties, and higher the further north and west you travel across England. This improvement in retention rates is bad news for job hunters, and also bad news for recruitment agencies that make their profits from schools advertising vacancies unless schools’ resort to only offering one-year contracts that are not then renewed.

Any reduction in job opportunities may also be bad news for teachers trying to return to work in the United Kingdom from abroad. Add in the decline in the number of pupils in private schools, some 11,000 in the latest data, when compared with the previous year’s data, and that might be somewhere around 750 less jobs in that sector in one year.

Although retention is better for the first two years of service in the latest data from the DfE, rates still have some way to go to return to levels of twenty years ago.

% in service after each year of service2003 entrantsLatestDifference
19189.7-1.3
28580.5-4.5
38173.2-7.8
47870.2-7.8
57667.6-8.4
67564.6-10.4
77362.5-10.5
87060.6-9.4
96859.2-8.8
106657-9

The table compares the latest data with the 2003 entry cohort survival rates for their first ten years of service. So, 66% of the 2003 cohort were still in teaching after ten years, but only 57% of the 2014 cohort were still in teaching after ten years.

The table shows an alarming difference for teachers with six to seven years of service, the group that might be expected to be taking on middle leadership positions. Hopefully, the new pay rise will be a further incentive to persuade teachers to to quit. Knowing why they do quit, and where they go, is some other data the DfE might wish to share with everyone.

Retaining teachers is more of a challenge; no surprise there

What is the pattern of teacher retention, now the profession is now overwhelmingly staffed by women? Do women teachers have different career patterns to men? One obvious difference is the length of time taken out for maternity leave. But do other caring roles later in life also mean different career paths for women teachers than for men in the profession?

The DfE provides data on the percentage of the teacher workforce still in post after different lengths of service from one year of service up to twenty-five years. Thus, someone stating at 22 would by 47 after 25 years of service. Some teachers leave and re-enter, so it possible for percentages to increase year on year for the same length of service as well as reduce. The latter is the more normal case, but in the latest data, the percentage of teachers still in service after 14 years increased by o.1%, presumably because of returners. This would likely be teachers in their late 30s returning after a career break to bring up a family. The main DfE tables do not provide data on teacher retention by the gender of the teacher.

Years of servicechange on previous year %change on 5 years previously %
1-0.42.3
2-2.6-1.7
3-0.9-2.5
4-1.2-0.8
5-0.1-0.4
6-1.2-1.2
7-0.4-1.1
8-1-3.7
9-1.1-3.9
10-1.1-3.4
11-0.1-1.9
12-3.2-2.8
13-0.8-0.8
140.1-0.7
15-0.3-2.8
16-0.5-3.6
17-0.8-3.9
18-0.6-3.9
19-2-3.2
20-1.7-0.4
21-0.6-1
22-0.4na
23-0.3na
24-0.3na
25-1na
Source: DfE School Workforce Census 2022

The above table shows the change this year from last year, and from five years ago for each year of service as published this year by the DfE. The percentage of teachers remaining after one year of services was 0.4% lower than for the one-year service percentage recorded for pervious cohort. For those with 16 years of service, the five-year percentage was 3.6% below the figure for the previous cohort.

The rate of loss, both after one year, and over five years for teachers with between eight to ten years of service, and with 17 and 18 years of service, must be a matter for concern, and perhaps investigation as to the characteristics of leavers and what are the causes of their departure?

Are these teachers quitting teaching or just moving out of the state sector? The DfE has indicated that it wants increase the recruitment of teachers from overseas. The Home Office might be concerned about such a practice and its implications for migration statistics, and could rightly argue that improving retention might be a more cost-effective way of staffing our schools? After all the National Audit Office said the same thing some years ago.

The House of Commons Education Select Committee will shortly start publishing the evidence it has received for its inquiry into teacher recruitment and retention that was announced way back in March. Hopefully, the issue of retention will receive as much attention as recruitment does.

Happy New Year: we can but hope

For most of the past 30 years, I have spent the week between Christmas and New Year drafting annual reports on aspects of the labour market for teachers during the previous 12 months for TeachVac’s and its predecessors, and also making a prognosis of what might happen in the labour market during the year to come. The finished reports; one on classroom teachers and promoted posts, and the other on leadership scale vacancies should, this year, be completed by the middle of the month.

Headlines include the steep increase in recorded vacancies across all grades during 2022; and the fact that schools in an around London recorded more vacancies than schools elsewhere in England. The problems, although not confined to the secondary sector are worse in that sector than in the primary school sector, where pupil numbers are now falling across much of England.

Of more interest that what happened in 2022 for most readers of this blog is, no doubt, my predictions for 2023. Based upon the trainee numbers in the DfE’s ITT census as a starting point, and abstracting those trainees already in the classroom and less likely to be job hunting, at least for a teaching post, for September 2023 from the totals, the numbers must be of concern.

After factoring in non-completions; those seeking posts in Sixth Form Colleges or elsewhere in publicly funded education outside of schools; and allowing for the demand form the private school sector, especially in the south of England, where a large number of such schools are concentrated; the final numbers may be the worst this century.

If the London region is taken as an example, using 2022 vacancies as the basis for the calculations, and assuming 40% of classroom teacher vacancies are taken by new entrants to the profession, with the remainder filled by those returning to teaching or switching schools, then some subjects do not have enough trainees to meet the possible demand from London’s schools

Open MarketLondon Vacancies in 202240% Vacancies from TraineesRemaining Trainees % Open Market Remaining
Business Studies164837335-171-104%
Religious Education249715286-37-15%
Computing304818327-23-8%
Music2285112042410%
Design & Technology3728293324011%
Physics3667442986819%
Geography52391436615730%
Modern Languages60099039620434%
Biology49574429819740%
English1214162965256246%
Chemistry64474429834654%
Mathematics1467151860786059%
Art & Design44043517426660%
History95040216178983%
Physical Education129522690120593%
Source TeachVac http://www.teachvac.co.uk

Business Studies, religious education and computing might be the most worrying subjects for London schools seeking to fill vacancies. Of course, a school advertising in January will always fare better than one looking for an unexpected appointment for January 2024 late in the autumn, but schools should not need to be worrying about filling vacancies advertised as early as February this year.

TeachVac is increasing its registers of teachers looking to be matched to jobs, and secondary schools wanting their vacancies matched can sign up for £10 a week (£500 per year plus VAT) or miss out on this resource that aims to match 15,000 teachers this year. Sign up at www.teachvac.co.uk

STRB misses the point?

There is a lot of good data in the STRB Report published yesterday. School Teachers’ Review Body 32nd report: 2022 – GOV.UK (www.gov.uk)

Sadly, most of it, as far as the teacher labour market is concerned, is based upon data collected by the DfE in November 2020 in the School Workforce Census, and thus relates to the labour market cycle of two years ago. Even if, when compiling the Report, the data from the November 2021 Census was used that was still from a previous labour market. As regular readers of this blog will know, the 2021-22 labour market for teachers has been anything other than normal in terms of demand for teachers.

The STRB has at least been able to use the ITT Census of 2021 that provided the data about the supply of new teachers for September 2022. Readers will find little in the STRB Report that hasn’t already been covered in this blog in relation to that data.

However, the Table on pages 49 and 50 of the STRB Report tells the story of this labour market in two simple charts regarding ITT recruitment; with history, PE and Art being the only secondary subjects where the supply of new entrants has been anything like at the level required to meet demand.

Interestingly, TeachVac today added art as a subject with a ‘red’ warning of shortages possible anywhere in England for January 2023 appointments. That just leaves PE and history as the two subjects where supply is still not yet at a level for a ‘red’ warning. PE might reach that level in the autumn: history, even with a contribution to humanities posts, almost certainly won’t. In view of the fact that almost double the number of trainees was recruited compared with the TSM figure that isn’t really a surprise. There is little problem with the primary sector labour market across most of the country.

The STRB Report is an interesting analysis of how the labour market responded to the sudden appearance of the pandemic just at the time when vacancies for September appointments were reaching their peak. Essentially, the market seems to have paused in 2021, and, as we know in 2022, there has been this surge of vacancies. As the end of term approaches, TeachVac has recorded not far short of 80,000 teaching vacancies across England so far in 2022, and more than 95,000 across the school-year as a whole.

The STRB has some interesting observations about leadership vacances, and the problems of recording trends when some posts in MATs are ‘out of scope’ to use the STRB terminology. However, as TeachVac has reported, there does not seem to have been any mass exodus of school leaders. This is despite the massive burdens placed on headteachers and other school leaders as a result of the pandemic, and the need to keep schools open at all times.

On pay, make of the Report what you will. I personally doubt that their recommendations for 2023/24 will last the test of time, especially if inflation continues to remain close to current levels and interest rates increase. With little new cash around for schools, it might be worth looking at the history books for how schools coped with the economic crisis of the late 1970s and early 1980s to see what might happen over the next few years. Although, back then, there was no spending on computers and other IT equipment.  

More teachers take maternity leave

TeachVac records the reason for vacancies as part of its intelligence gathering about the labour market for teachers in England. Each vacancy is classified and placed into one of three categories: permanent position; temporary post or maternity leave vacancy. Where the school doesn’t provide a reason for their vacancy, the default is that the vacancy is for a permanent position.

Regular readers, and those that study the labour market for teachers in any detail, will know that 2022 has been an exceptional year for vacancies, with record numbers being recorded so far this year and approaching 100,000 vacancies across the whole of the 2021-2022 school year.

The lack of any unique job identification number means that it is impossible to know the percentage of re-advertisements in the overall total of recorded vacancies. However, so great has been the increase, even over pre-covid vacancy levels that it must be inferred that there are more vacancies than normal.

To what extent has any growth in teachers taking maternity leave played a part in the increase in vacancies? There has been an increase, as the data in the table below reveals. Between January and June 2021 TeachVac recorded 4,386 vacancies where the cause of the vacancy was as a result of a teacher taking maternity leave. In the same period in 2022, the number had increased to 5,627 by 28th June. Now, cognisant of my comment above, it is entirely possible that some of the growth in maternity leave vacancies is the result of re-advertisements, but it seems unlikely that re-advertisements account for the whole of the growth in such vacancies.

Maternity leave vacancies recorded by TeachVac

Primary SectorSecondary SectorTotalDate range
Maternity256430635627Jan-June 2022
Maternity202423624386Jan-June 2021
Maternity353941567695All Year 2021
Source TeachVac

Now it is also possible that more schools are citing the fact that their vacancy is due to a teacher taking maternity leave. The alternative might be to advertise for a temporary post not citing the reason why the vacancy was temporary.

January to June 2022
 Primary SectorSecondary SectorTotal
Maternity256430635627
Permanent159254878764712
Temporary437122496620
Total228605409976959
Maternity11%6%7%
January to June 2021
Primary SectorSecondary SectorTotal
Maternity202423624386
Permanent100942412834222
Temporary378718385625
Total159052832844233
Maternity13%8%10%
2021 – All year
Primary SectorSecondary Sectortotal
Maternity353941567695
Permanent140793337047449
Temporary593232079139
Total235504073364283
Maternity15%10%12%
Source: TeachVac data

However, there has been a significant growth in the number of permanent vacancies recorded this year, up from 34,222 to 64,712 for the January to June period between those months in 2021 and those moths this year in 2022. Again, it isn’t possible to know the extent that re-advertisements are included in the increase. There will almost certainly be more re-advertisement than in a year when the supply of new teachers entering the market was greater than it has been this year, but I doubt re-advertisements are the main cause of the increase.

Keeping in touch with teachers taking maternity leave to encourage them to return, either part-time or to tutoring or in other type of work within the school would be a cost-effective means of not losing touch with a vital resource. The National Audit Office some years ago now commented that retention was much ore cost-effective than recruitment. Perhaps it is time the DfE dusted off a national ‘keep in tough’ scheme?

Keeping science teachers in schools

This is an interesting article written with the support of The Gatsby Foundation on the effect of special retention payments on keeping mathematics and science teachers in state schools Paying early career science teachers 5% more keeps significant numbers in the classroom | Education | Gatsby Personally, I wish researchers would not talk about teachers leaving the profession when they mean no longer working in stated funded schools. These teachers might be working in private schools, the further education sector or Sixth Form Colleges whose employees are not captured in the annual Teacher Workforce Survey.

My other concern with this interesting piece of research is the regional bias to the data. As a result of using specific payments rather than the generic use of retention payments, most of the areas surveyed are in either Yorkshire and The Humber region or in the North East of England. The latter region offers teachers few opportunities for transfer between schools due to the limited number of vacancies each year compared with other regions according to TeachVac data www.teachvac.couk .

The fact of reduced numbers of vacancies on offer might mask a group of teachers staying in state schools, but moving to a different school. In Constable et al (1999) a research report for the University of Northumbria on the supply of teachers of physics, the ability to teach ‘A’ level physics early in a teaching career was an important motivation for teachers, as was the opportunity to teach mathematics rather than the other sciences for physicists when not timetabled to teach physics.

In a part of the country, such as the North East, with relatively little other graduate opportunities, especially compared to say the London region where not only are they many private school vacancies but also a buoyant graduate market, it would have been interesting to review the cohort in this Gatsby funded research with say a similar cohort of Teach First trainees to review any differences in the economic benefits between classroom based salary supported training and post-training retention incentives.

Of course, keeping teachers in schools is only part of the battle. Such policies help the schools where these teachers work but do nothing for other schools suffering as a result of the overall shortage of teachers in say, physics. Do subject enhancement courses that attract more recruits have a better economic return or could perhaps retaining other science teachers or even mathematics teachers to teach physics be more cost-effective than offering higher salaries to those that have chosen to teacher physics. Understanding, as Constable et al tried to do, what motivates physics teachers either to stay or to leave ibn more general terms might help devise new policies to overcome teacher shortages.

Tracking expertise might also be helped if Qualified Teacher Status was tied to specific subjects and only temporary accreditation to teach a subject was granted to those without the appropriate training and subject knowledge.  This might help keep better track of where shortages are to be found.

London teachers more likely to receive additional payments

On 11th February 2018, I wrote a blog post about pay flexibilities for teachers, and the use of allowances. Pay flexibilities for teachers | John Howson (wordpress.com) The DfE’s 2022 evidence to the STRB, referenced in recent posts on this blog, has a table on page 65 that allows an update for the position in November 2020.

According to the DfE’s evidence to the School Teachers Review Body (STRB) in 2018 only 64%, just fewer than two out of three schools, paid any of their staff Teaching & Learning Responsibility allowances (TLRs as they are usually known). I guessed in 2018 that most of the remaining nearly 8,000 or so schools were mostly small primary schools, with only a handful of teachers and a head teacher? In November 2020, the percentage of schools paying a TLR was almost the same as in 2018, at 63.7% of schools. Presumably, it was still the small primary schools where there were no TLRs paid to staff.

Interestingly, the DfE record that 76.7% of schools in 2020, compared with 75.2% of all schools in 2018, make some form of payment to some of their teaching staff. The lowest percentages were for schools in the East midlands and Yorkshire and The Humber Regions.

In 2020, 20.7% of schools were using SEN payments, rising to 27.8% of schools in the South East of England. In the Yorkshire and The Humber Region only 14.2% of schools were making SEN payments: not far short of half the percentage of schools making such payments in the South East of England. This difference seems significant enough to need further investigation.

Even less common than SEN payments, despite all the talk about a recruitment crisis, has been the use of recruitment and retention payments to teachers; only 8.9% of schools across England were recorded as making such a payment in November 2020. However, the percentage does rise to 18.2% schools in the Inner London area – That’s not technically a region and the DfE evidence doesn’t define what it means by Inner London and whether it is pay area or some other definition. By contrast, only 4.7% of schools in the South West makes any payments to a teacher or teachers for recruitment and retention reasons. The DfE doesn’t make clear how many teachers in the schools receive such payments. It is enough for just one to teacher to receive a payment for a school to qualify for inclusion in the table.

The use of additional payments to teachers doesn’t seem to have changed much during the past few years. This despite the challenges schools have faced in recruiting teachers with some specific subject knowledge. The pressure on school budgets may well have accounted for an unwillingness to spend more of the school’s funds on extra allowances, over and above those already in the system.

It will be interesting to see how schools will react to the challenge of the £30,000 starting salary and the need to motivate more experienced staff if differentials are reduced, especially if new teachers retain the right to a lighter timetable.

Middle Leaders need attractive salaries as well as new entrants

Contained within the DfE document to the STRB that was discussed in the previous post is the annual update on retention and wastage rates for teachers. This year, as part of a much more detailed analyses, there are tables for different subject groups and phases as well as for different parts of England.

As usual, the data are presented as percentages that need to be converted into numbers to make real sense what is really happening. The gross numbers for the profession as whole for entrant and those still in service after a year for the recent past are shown in the table.

New entrants into teachingentered serviceend Year 1loss in Year 1
201223998208783120
201324490213063184
201425927222973630
201526780230313749
201625560217263834
201723754201913563
201823872202913581
201923338198373501
Teachers in service

The number remining can vary by several thousand depending upon the starting number. Thus, 2015, a good year for recruitment into training, resulted in 23,031 new teachers in service at the end of year one. By contrast, in 2019, although nearly 250 fewer teachers departed than from the earlier entry year, the lower starting number resulted in only 19,837 of that cohort of teachers remaining. That’s some 3,000 fewer than from the 2015 cohort of starters.

Wastage doesn’t stop after the first year, and the DfE document considers wastage over time between STEM and non-STEM secondary subjects, although it doesn’t provide data for individual subjects. Taking design and technology as a STEM subject, the DfE’s 2013 ITT census had a total of 410 trainees. Now assuming the 82% STEM subjects after QTS is based for that group based upon the ITT census would leave some 336 teachers still working at end of year one.

Assuming the data is actually those granted QTS, and allowing for a 5% non-completion of the course, this brings the entry number down to 390 and those remaining after a year to 320.

From the 320/336 teachers must eventually come those to be promoted to TLRs, including as heads of department. Now, after five years of service, those with continuous service and excluding those with a broken service record, might be in the range of 220/250 teachers across the subject using the DfE’s percentage remaining in service for STEM subjects.

According to TeachVac’s database, there were 390 recorded vacancies with TLRs in 2020 across design and technology as a subject area, and 470 in 2021. Up to the end of the first week in March 2022, there had already been 228 advertised vacancies with TLRs in design and technology. Now some of the vacancies will have been repeat advertisements, and others re-advertisements. However, even if half were discounted for these reasons, it might still mean 200 or so posts each year. Such a number would be a very large percentage of the cohort of teachers in the subject and adds a further level of concern to the future of the subject.

Middle leadership is of vital importance to the successful operation of our schools, and in concentrating on the starting salary the DfE and STRB must not lose sight of the need for successful teachers willing to spend their careers in our state school system.