Are teachers paid a fair wage for being a graduate?

Last week, the DfE published the latest report from the School Teachers Review body (STRB) School Teachers’ Review Body – THIRTY-SIXTH REPORT – 2026 This is the 36th Report from this body. Its recommendations on pay were accepted by the Secretary of State.

While the headline increases in pay, in percentage terms, seem generous, in reality they are part of a catching up exercise of a similar type to that which caused the hard-fought battle with resident doctors in the NHS.

Here’s what the STRB said about teachers’ pay over the past decade and a half:

The real-terms value of median teacher earnings has fallen since the early 2010s. The fall in real teacher pay has been greater than that for other professional occupations.

• When comparing teachers’ pay to that of other professional occupations by age and region using data from the SWC and the ONS, teachers fell below the comparators in all groups. The gaps between median teacher pay and that of other professionals was greatest in London.

• Based on proprietary benchmarking data, starting pay for teachers is between the lowest quartile and median for roles of comparable size and scope.

These three comments seem to justify the pay rise, and it is not a generous settlement in a vibrant labour market for graduates. If that market cools between now and 2027, possibly because of the effects of AI on entry level jobs, it will be interesting to see what the next STRB pay report suggests.

The STRB summed up the situation in the most recent period as follows:

In 2024-25, for the Rest of England and London, teachers’ median earnings were below those of the comparator groups for all age bands. The gaps between teachers’ earnings and those of the comparator group were greatest in London.

Across most age categories, the relative earnings of teachers deteriorated from 2014-15 to 2019-20, both in the Rest of England and London. After a slight improvement in 2020-21 during the COVID-19 pandemic, this downward trend for relative earnings continued across all age categories to 2023-24. Over the latest period, between 2023-24 and 2024-25, the relative earnings of teachers have slightly improved, although their median earnings remain below other professional occupation counterparts.

Overall, teachers aged 21 to 30 compared least favourably against the other professional occupations, both in the Rest of England and in London. Those in the oldest age group (over 60) compared most favourably, although are still behind relative earnings of those in other professional occupations. Page 70

In summery the STRB concluded that;

Our analysis of real-terms pay changes over time suggests that the competitiveness of teachers’ earnings compared to the whole economy, wider public sector and to professional occupations, was lower in 2024/25 compared to 2010/11. Figure B.10 shows how the real-terms value of teachers’ median earnings fell throughout the early 2010s. The chart shows there was some improvement for teachers between 2018/19 and 2020/21, prior to the pay pause in 2021/22, and a period of decline to 2023/24. There was some improvement in 2024/25, however we estimate that teachers’ median gross earnings in 2024/25 were 13.9% below their level in 2010/11 in real terms. Median gross earnings for the whole economy were 0.6% below their 2010/11 level, whilst median gross earnings for professional occupations were 9.2% below their 2010/11 level, in real terms. Page 71

One issue potentially facing the STRB could be the problem of a single pay scale for all teachers when the labour markets for primary and secondary school teachers are operating in very different ways. However, it would be a brave government that tackled this issue. Most likely, a move on allowances, and how they are offered, could be the obvious way to tackle over-supply in the primary school labour market, and areas of shortage in the secondary school teacher labour market.

The STRB had something to say about the axing of bursaries from some ITT subjects.

111. The number of bursaries available for 2026/27 has been reduced across a range of subjects, with others seeing a reduction in the bursary value. The bursary values for Biology and Geography are both down by 21,000, while Modern Foreign Languages and Design Technology are down by 6,000. Art, Music and Religious Education are down by 10,000 to zero, with English down by 5,000 to zero. We also note that for Business Studies, Music, Religious Education, Modern Foreign Languages and Design Technology, the reduction in bursary value coincides with the failure to reach target entrant numbers in 2025/26. P101 My emphasis

There is also an interesting table (B21) that provides evidence to support my posts over the past year querying why music and also Religious Education lost their bursaries. Pages 100 to 102, and especially table B21, where music and Religious Education were placed in the top three subjects for the lowest percentages of ITT placed filled, provide cogent evidence for the need for an explanation as to how bursaries are allocated to different subjects?

I think the STRB are sending a coded message to the DfE in this report about the lack of bursaries in some of the subjects that struggle most to recruit. The DfE’s answer, backed by HM Treasury, would no doubt be that there are few graduates in these subjects to entice into teaching, so the bursary would be paid to those already choosing teaching as a career. Funny how that argument doesn’t work for physics or mathematics.

A couple of other interesting nuggets for the STRB report:

• In 2024/25, male teachers had higher earnings overall than female teachers across all school types. Median earnings were higher in secondary schools than in primary and nursery schools.

• Based on proprietary benchmarking data, starting pay for teachers is between the lowest quartile and median for roles of comparable size and scope. …. The comparative basic salary position of leadership roles in primary schools is generally below the market base salary data, whilst roles in secondary schools are better aligned to the market base salary data.

• The full-time equivalent (FTE) teacher workforce decreased by 0.1% or 432 between 2023 and 2024. Secondary schools once again saw the largest absolute increase in teacher numbers.

• The proportion of teachers from an ethnic minority background remained stable, with 89% of teachers across state-funded schools being white. The proportion of white teachers is higher in nursery and primary schools than in secondary schools and increases with seniority in leadership roles.

Finally, a word about leadership pay. The STRB concluded that:

2.25 The comparative salary position of leadership roles in primary schools falls below the market salary data in all regions, whilst leadership roles in secondary schools are better aligned to the market salary data. P11

After a year of tracking headteacher vacancies, I do wonder why anyone would take on a job both teaching and leading a small primary school for a salary of little more than £60,000 from September when a classroom teacher with no responsibilities, and a similar length of service could be earning nearly £53,000.

Little more than £10,000 extra, for both the loss of the 1,265 working time protection and all the extra responsibilities, seems like a gross imbalance in differentials. This is especially the case when all primary leaders, and not just headteachers, work on average 5.1 hours more than classroom teachers. Table B14 page 91.

I will say more about the issue of headteachers’ pay when I publish my review of headteacher vacancies for 2025-26 at the end of August.

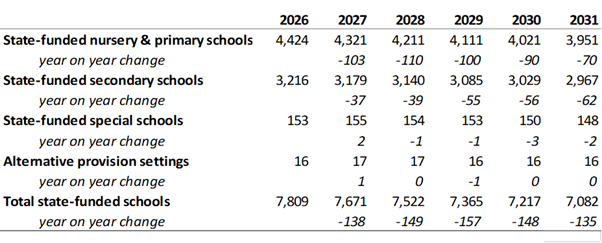
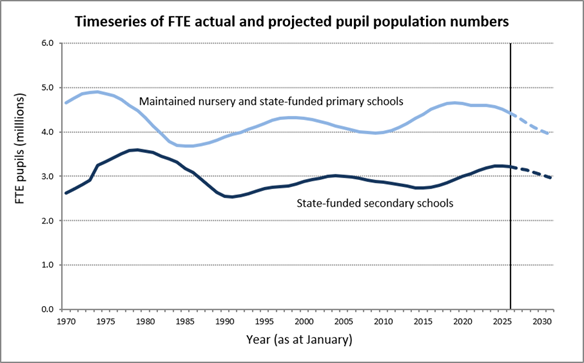
The saviour for the government when considering future pay is ‘falling pupil numbers’. This issue makes the need to recruit teachers, especially with the current age distribution of those teachers in employment less of an overall challenge.

However, as indicated earlier in this post, dealing with the consequences of different primary, secondary and further education labour markets may be a real issue for the next STRB Report.

Dear Secretary of State – updated

Two years ago, after the general election, I posted this open letter to the new Secretary of State. With the possibility of a cabinet reshuffle following the arrival of a new Prime Minister, I though it was worth taking a second look at my thoughts of two years ago, and what has changed.

Posted on July 6, 2024

At this important time in our history, I thought that I would post my views for the new Secretary of State for Education

An Open Letter to the Secretary of State for Education

Dear Secretary of State,

You have a tough job ahead of you. Firstly, you need to clear up problems resulting from the campaign promise of 6,000 extra teachers. Those of us in the know, are aware that this September, as for the past few years, all the training places for new secondary school teachers are not being filled. Those gaps need to be filled before you can start on adding 6,000 new teachers to the total.

We don’t have 6,000 more teachers, and training targets have been cut in many subjects, so reaching what you and I might have thought of as 6,000 extra teachers seems unlikely, and the pledge will be subject to a sleight of hand to show it has been achieved.

Don’t think of an easy way out, such as upgrading some teaching assistants to teachers, because it is teachers for the secondary schools that we need, not more teachers for primary schools.

And then, there is the state of our school buildings. Even before the concrete crisis, many of our primary schools were time expired, and many are more than 150 years old. There needs to be a programme of replacement and, for those that will remain, a programme to help make them carbon neutral or even sources of renewable energy. After all, school playgrounds are not being used for their key purpose for 95% of the year. How can we make them earn their keep for the rest of the year, by being sources of renewable power?

Some progress on buildings, but not much, and no real policy advocacy around renewables.

Don’t get me started on funding for 16-19 year olds. That’s a battle with the Treasury you must win. At the same time, you could increase the upper age for free transport for young people in rural areas from 16 up to the de facto if not de jure leaving age of 18 from where it now stops at 16. Start by offering it this September to those staying in the same school. This is a levelling up programme for rural areas.

Rural transport, and indeed, 16-18 transport has been ignored. This is despite the fact it may contribute to NEET numbers in rural areas. I have suggested reviewing motor insurance tax for 16-18s where there is no public transport to school or college, and extending free transport to 18 for those that receive it up to age 16. No sign government understands this issue.

AI and technology are important to our country’s future, and we need to work out how they impact on our education system. Are we training new and existing teachers in a curriculum and teaching style for the future, not the past? Do we need a research body for teaching and learning in schools?

Much more to be done here; especially in training new teachers. New teachers entering preparation courses this September at age 22, might not retire until 2063. In the past 40 years we have seen, the microprocessor revolution; the internet and social media sensation, and now AI. How have we responded to this revolution, every bit as significant as the arrival of printing more than 500 years ago: we have banned mobile phones from schools.

I am sure you will have much to say about early years, and perhaps you could reverse the name change Mr Gove announced when he had your job in 2010.  Bring back the Department for Children Education and Families.

Hopefully, early years will be a success story, but outcomes need monitoring especially for those children that fall behind when they reach school. Do you favour schools having an on-site nursery? What about a qualified workforce?

There are other issues, such as higher education, private schools and the consequences of VAT on fees, and the relationship between local authorities and the academies sector, not least for children in care that you will have to deal with, but solving the teacher supply crisis is the number one priority.

Well, we have VAT on school fees and it has shaken the tree for some of the weaker schools that were also suffering from falling rolls. However, there are still not enough teachers for state schools, and private schools can attract teachers where there are shortages leaving more challenging schools with less well qualified staff. What’s the policy to deal with this problem?

The dual regime of democratically controlled local authorities nominally responsible for maintained schools and the academy sector responsible to Whitehall and with no local democratic accountability is a blot on your copybook. Following the Blair/Brow government’s line on ducking the issue of selective schools for some and comprehensive schools for others is a waste of a big majority, especially as most Labour MPs represent areas with comprehensive schools.

You could take a leaf out of David Blunkett’s approach in 1997, and pay the fees of all trainee teachers studying as postgraduates to enter the profession. Paying them all a training salary, as his successor introduced, and the coalition removed, would be another step forward. This year, it should be possible to pay the bills from the unfilled training places where the money has already been allocated by H M Treasury plus the VAT receipts from private school fees.

Training to be a teacher is still expensive in debt terms for many. Working abroad after qualification can bring higher income, and no fee repayments while abroad.

If the government is serious about education, then now is the time for action. Good luck in your first 100 days in the job.

However, will you still be in post after the arrival of the new Prime Minister? Of will we have to start all over again?

Is the DfE’s Teacher Supply Model outdated?

For most of my adult life, the government department responsible for the supply of teachers, whether it was called the DfE, DES, DfEE or by another name, has used a version of the Teacher Supply Model to calculate future teacher needs, and presumably to ensure the government doesn’t waste money training too many teachers.

Training too few teachers, not as a result of the Model, but because of under-recruitment into training, has been a problem for the Teacher Supply Model (TSM) during periods of teacher shortage. Do you either add the under-recruitment to the TSM target in any one year to the next year’s TSM total, thus making it even harder to reach, or do you accept every school starts each new school year in September fully staffed, so there are no vacancies to be filled, even if additional trainees just happened to be recruited. Over the past forty years, both approaches have been tried: neither really works.

I first came across the TSM in the late 1980s when, in response to a Select Committee Report, a technical document explaining the working of the TSM at that time was published. Between the late 1980s, and a seminal announcement, also to a Select committee, by David Laws when he was the Minister of State that the TSM would be part of open government, the TSM remained largely secret, apart from one other document published in the late 1990s in repose to yet another two Select Committee reports.

Why were successive government keen to keep the TSM under wraps? Possibly because the workings allowed for an understanding of future government policy. There are three obvious areas where changes in policy can have consequences for schools and society that might create political debate: reactions to future pupil numbers, whether up or down; changes in education funding that might allow more or less funds for schools; policy changes such as extending the learning leaving age or the introduction of a new subject, such as citizenship or computing. All impact on the TSM

Governments often don’t want to signal policy changes ahead of time, especially if they might be controversial. In the first decade of this century, the secrecy around the TSM almost caught out the ITT sector when falling rolls together with improved ITT recruitment made a reduction in ITT numbers inevitable for secondary subjects, especially as there was no policy around improving staffing levels in the secondary sector, partly because of the decision over the introduction of non-contact time in the primary sector.

Planning is an essential too of any organisation, including governments, whatever extreme free-market thinkers may say. After years of following the consequences of the TSM decisions on the outcomes for the teacher labour market, I have some concerns about what happens when the TSM has been run for any particular year. The elements of the TSM have changed over the years, as explained above in relation to under-recruitment as an example. That’s not an issue for me, although the discussions with the sector may have helped prevent some changes to the TSM in mor recent times.

What is at the core of my concerns about the TSM is the length of time between the collection of the data for input into the TSM and the consequences for the real-time labour market for any September recruitment round, let alone the needs for teachers to fill any January vacancies.

I acknowledge that improved and faster data collection over time thanks to better computing capabilities has helped reduce the time taken between data collection and the effect on the labour market of the TSM output for any recruitment round. Currently, data from the 2025 School Workforce Survey, collected in November 2025, will probably influence the TSM run for the 2027 entry into training, and hence, the 2028 labour market.

At least with most trainees now on a one-year postgraduate training route, there is no longer the issue of a four-year undergraduate course to add into the mix. The November 2025 data collected, if such courses were still a significant part of the ITT scene, would not affect the labour market until 2031. A lot can happen in the intervening years.

Even with the shorter training period, there is still a time lag between data collection and the consequences of that data on the labour market.

My question is, should a further check be added once the TSM has been used to calculate ITT targets, in order to allow the comparison between the TSM target and the current reality of the labour market?

The DfE now has excellent data from several years of operating its own vacancy platform, and there are also private operators monitoring the labour market with useful vacancy data in real time. This data can be compared with the TSM output target to allow a discussion about the validity of the TSM target to current labour market needs.

Now, it may well be that the TSM number is the best fit for training needs, but as my previous post that considered the labour market data for teachers of music alongside the ITT target cut that presumably emerged from the TSM output has suggested, the addition of vacancy data does allow for a debate about whether the TSM target under or over estimates demand. Music ITT: has the government made a mistake? | John Howson

Such use of vacancy data also allows for a consideration of policy changes, such as how schools react to a change in a market where QTS still allows any teacher to teach any subject to any child, and ‘permits the use of unqualified staff. where nobody with QTS is either available or considered sufficiently expert at delivering the curriculum.  

The TSM isn’t outdated, just, in my opinion, no longer enough by itself to ensure an orderly labour market for teachers.

Why is this important, it is because the market does play a part in determining how shortages are dealt with. Where are the qualified teachers of physics teaching? How much more do schools with high levels of free school meals have to spend on recruitment than a school with fewer such pupils? Important questions around the staffing of the nation’s schools.

I read the Fed report on education issued yesterday National Education Report 2026 – FED and believe that the supply of teachers and school leaders is still at the heart of any effective system of education.

How any government determines teacher supply is a vital decision affecting the lives of many young people. Ensuring every child has the best possible teachers throughout their whole school-life is equally as important as whether or not they are banned from social media, but much less often discussed.

I think that teacher supply issues should be much higher up the education agenda, but I would, wouldn’t I, having spent a career worrying about teacher supply matters.   

Music ITT: has the government made a mistake?

New entrants to postgraduate teacher preparation courses in music in 2026 will not receive a bursary. Instead, they will be need to rely upon either student loans or other funding. How has this change affected applications to train as a music teacher?

The news is not good. The June data for applications is the second worst number since the 2013/14 round more than a decade ago. Only the 2023/23 round post covid that was a terrible round across all subjects, has recorded a lower figure for applications than June 2025. In context, the June number of offers, a better measure than applications, is not far short of half the level seen in the covid year of 202/2, and around 25% below what might be expected in a usual round.

Worry, not because the government has decided that falling rolls over the next few years will mean fewer teachers of music need to be trained. Reducing the target from a requirement of 565 teachers of music in 2024/25 to just a requirement of 260 new trainees in 2025/26 suggests either the previous targets were way out of line or a need to justify the removal of the bursary by setting a target that can be met. After all, it would be unfortunate to remove the bursary as unnecessary, but still miss the target.

So, what of demand from state schools for music? Since January, and the start of the recruitment round for September 2026, I have recorded some 530 schools advertising for a teacher or music. Allowing for the fact that perhaps 100 had a TLR attached, so were not ideal for newly qualified teachers, this suggests 400 posts for newly qualified teachers so far. Add in perhaps another 100 autumn term vacancies and overall demand might be in the range of 400-500 posts or 500-600 posts overall.

The DfE expects about half of vacancies to be taken by existing teachers or returners each year. The exact number depends upon where the demand is and how it relates to supply. But, sticking with the 50% figure means a demand for around 250 to 300 new entrants each year.

Now, with falling rolls be might reduce that number by 10% to 225 to 270 as a requirement. On the face of it, the new target of 260 look risky but manageable. However, it must include two assumptions: all those that are offered eventually complete their courses and of ‘completers’, all join the state secondary school sector.

Both, based upon past trends are unrealistic assumptions. Being generous, 90% of those offered places complete the course. This suggests an output of 236 against a target of 260. Rounding up to 240 new entrants, this mean the new target is still not way of demand.

However, not all ‘completer’s join state schools. Some don’t enter teaching at all; some join Sixth Form Colleges or primary schools; some join the independent sector and some may decide to work overseas in the growing international school market. The 2025 data Less than 400 teachers of physics entered service in 2023/24 | John Howson based upon 2023/24 entry patterns showed that 80% of those gaining a QTS on a music ITT course entered teaching in a state-funded school. This includes both primary, secondary and special schools.

Assuming the 80% as a baseline – the next set of data should be out next month – our total of 240 reduced to less than 200. That number is starting to look as if the cut to music ITT places has been too savage.

A cynic might suggest, but I never could, the target was reduced to ensure it would be met and to save face over the removal of the bursary.

Whatever the reason, the DfE has now risked demand continuing to outstrip supply and this to affect the teaching of music in the nation’s secondary schools. With the recent announcement of the programme to ensureEvery child to get access to enriching activities to build skills and confidence for life’, the new target looks even less sensible  Every child to get access to enriching activities to build skills and confidence for life – GOV.UK.

I haven’t seen any campaign from the sector asking the government to revisit the target, but perhaps there should be in light of these numbers unless falling rolls are going to affect the demand for teachers of music more than I have calculated.

I would welcome any comments on the data.

ITT: subjects recruiting from UK graduates still in trouble

The DfE’s June data on the current round of applications and offers for postgraduate ITT courses still revels that the 2026 round is separating into two distinct sections. Subjects where applications are likely to come from anywhere in the world are either already meeting their Teacher Supply Model target for 2026 entry, or should do so on the current trajectory. Subjects where home recruitment is likely to dominate applications seem more at risk of missing their targets.

SubjectTarget 2026/27offer May 2026Fill: May viewJune offersFill: June view
Chemistry6901015YES1199YES
Biology675474PROBABLY542POSSIBLY
Mathematics20002169YES2495YES
Design & Technology620481YES562YES
Art & Design605527YES601YES
Geography685407POSSIBLY455NO
Classics7540NO43NO
English19801418PROBABLY1586POSSIBLY
Drama370253PROBABLY283PROBABLY
Business Studies1200270NO301NO
Music260192POSSIBLY215PROBABLY
Religious Education450269POSSIBLY308NO
Others2035418NO456NO
History520872YES974YES
Modern Languages10851107YES1214YES
Physics8101342YES1466YES
Physical Education6551298YES1405YES
Computing565686YES794YES

Based upon ‘offer’ recorded in the June update from the DfE, and with just three more reports to come before courses commence, I have made four downgrades and one upgrade to my expected outcomes for the current recruitment round.

I have downgraded expected outcomes for, biology, geography, English and Religious Education, including reducing Religious Education to a ‘No’. however, I am aware that there is a vigorous advertising campaign currently underway by the Religious Education sector, reminiscent of the RETRI initiative led by Dr John Gay a quarter of a century ago. Success in attracting new applicants could mean that it would be possible to hit the target for Religious Education. I do wonder why more subject groups don’t invest in advertising the benefits of becoming a teacher.

If science graduates discover there is space for those with some biology, then that subject might reach its target. Music looks likely to meet the target, but that target, in my opinion, has been set far too low to meet demand from schools, especially with the DfE’s latest initiative on extra-curricular activities for all, including within the scope, music. It will be difficult to achieve success in music without more teachers. However, meeting the low target will justify the removal of the bursary for music ITT.

Applications from outside of the United Kingdom represented 25% of all applications this June compared with 18% in the data for June 2025. If all non-Uk applicants had applied for secondary sector courses, then they would currently account for more than a third of applicants across all subjects, compared with a quarter in June 2025.

More evidence of the lack of interest in teaching from hone-based students comes from the fact that the number of graduates in the age group ’21 and under’ applying for courses is only 115 higher this June at 3,685 compared with an increase in applications of nearly 2,000 from the ’30 to 34’ age grouping.

The increasing interest in teaching from men continues, with applications up from 16,796 in June 2025 to 21,774 this June! It would be useful to know more about where this increase is focussed, and what the implications might be for the sector.

As ever, the DfE continues not to share ethnicity data with the sector. With so many overseas applicants at present, is that a helpful omission from the dataset?

Higher Education continues to bear the brut of the increase in applications, with ‘partner led’ and ‘salaried’ routes static, and only a small increase in applications to SCITT courses. However, PG teaching apprenticeships have seen a healthy increase in applications from 6,328 to 10, 493. However, offers are little changed at 1,066, compared with 966 in June 2025.

Perhaps because of the arrival of the postgraduate apprenticeship route, offers for the ‘salaried route was only 266 this June, compared with 518 in June 2025. Mr Gove’s brave new world of 15 years ago now looks like a distant dream, as higher education continues to take the bulk of applications, proving the resilience of the sector in the face of determined onslaughts during the coalition government to remove its dominance from the training of new graduate teachers.

With the end of the school term rapidly approaching, the next three months traditionally see relatively few new offers: will this year be any different, especially given the press comments about graduates unable to find work, or does teaching still look like an unattractive carer to debt strapped UK graduates?

With falling rolls affecting job prospects after training  and the acquisition of more student debt, and a possible below inflation pay settlement, the signs for increased interest in teaching as a career during the rest of the recruitment round are not good.

It’s the numbers not the percentages that matter most

Each year, the DfE publishes details about the workforce in schools. The data about teacher numbers are collected in the School Workforce Survey, conducted every November.

Included in the data are details about teacher retention in state funded schools. Interestingly, although the DfE provided the actual number of NQTs each year, the retention data is shown as a percentage of that base number. Release home – School workforce in England – Explore education statistics – GOV.UK as demonstrated in the following table.

The picture is obvious, despite some late arrivals after qualifying, the percentage falls for each extra year of service, so that of the 2010 cohort, only 59.2% were still in service after 10 years.

 Over the past few years, the percentage in service after one year has fluctuated from a low of 85.1 for the 2016 cohort to a high of 89.9 for 2023 cohort, with the 2024 cohort still doing well, with a retention rate of 89.7% at year 2. This looks like good news for the government.

However, there is less good news for the cohort that joined during covid in 2020 and 2012. For these two cohorts, retention after four and five years is poor, and back to levels last seen in 2014 for the 2021 cohort.

So, good news, retention is improving. Might the government even meet its target of of 6,500 extra teachers? Now it is time to change the percentages into numbers.

Here the picture is different. I have projected an extra year for the 2024 cohort and two years for the 2023 cohort just to show what might happen. The behaviour of those two cohorts is very important as they represent the lowest intakes of NQTs since 2010. Sadly, the government doesn’t publish the table by sectors. This is important because it is the key secondary subjects that already start with shortages where retention really matters for the performance of the school system, and especially for the outcomes for children in schools with high percentages of pupils on Free School Meals.

The current ten-year loss numbers show a worrying trend.

Hopefully, this loss of experienced teachers will reduce over the next few years, as the cohorts following the 2015 cohort have better retention numbers and percentages. The real concern is the 2020 and 2021 cohorts.

However, with falling rolls, starting to appear in the secondary sector, and already seriously affecting the primary sector in London, the retention rates for teachers may well improve, if schools can continue to afford the same number of teachers.

As my previous posts have made clear, the relationship between the National Funding Formula and pupil numbers will be crucial to future size of the teaching force. Falling Rolls: Is the funding formula making matters worse? | John Howson

When is a pledge not a pledge?

When is a pledge not a pledge? Change Labour Party Manifesto 2024

The headline in Labour’s 2024 General Election Manifesto said:

“Recruit 6,500 new teachers in key subjects to prepare children for life, work and the future, paid for by ending tax breaks for private schools.”

Note, nothing about lecturers and further education, and key subjects weren’t defined

In the text of the manifesto the promise or pledge was slightly different. The commitment was to recruit an additional 6,500 new expert teachers. Again, no mention of lecturers and further education and ‘key subjects’ didn’t appear, but ‘shortage subjects’ did. Page 82

“The factor that makes the biggest difference to a child’s education is high-quality teaching; but there are shortages of qualified teachers across the country. Labour will recruit an additional 6,500 new expert teachers. We will get more teachers into shortage subjects, support areas that face recruitment challenges, and tackle retention issues. The way bursaries are allocated, and the structure of retention payments, will be reviewed.”

Interestingly, there was also mention of ‘support areas that face recruitment challenges, and tackle retention issues.’

In the review of the 2025 Workforce, the DfE comment that

“The government, in its opportunity mission, has set a pledge to recruit 6,500 additional teachers. Further information on this ambition can be found in the 6,500 additional teachers delivery plan (opens in new tab). Latest figures show an increase of 3,000 secondary and special teachers since 2023/24 which contributes to this target. Combined statistics across schools and further education show an increase of 4,654 against this 6,500 target.” Release home – School workforce in England – Explore education statistics – GOV.UK

There doesn’t seem to be any mention of how these additional teachers ‘support areas that face recruitment challenges, and tackle retention issues.’  According to the DfE, The pledge is for mainstream secondary schools, special schools, further education (FE) colleges, and FE school based providers; it does not include primary schools. Latest figures show an increase of 3,000 secondary and special teachers since 2023/24 which contributes to this target.

However, much of the increase may well be down to improved retention rather than increased recruitment. Sadly, the headcount for both physics and chemistry teachers for all years 7-13 are still below the 2020/21 figure

Physics

2020/21 6,693

2024/25 6,465

2025/26 6,127

Chemistry

Physics

2020/21 5,886

2024/25 5,602

2025/26 5,357

So, there must be some questions to ask about the number of teachers in these subjects, and the aim to ‘get more teachers into shortage subjects’.

Still, perhaps the percentage of hours taught by those with qualifications has increased. Sadly, not since 2020/21

Percentage of hours taught by teachers with qualification for ‘Subjects taught and Specialist teachers and hours’ for 7 to 13

Chemistry

2020/21 48.9%

2024/25 45.7%

2025/26 44/7%

Physics

2020/21 45.2%

2024/25 42.8%

2025/26 41.2%

So, increased ITT numbers and better retention has yet to feed through to the teaching of physics and chemistry. Perhaps it is because of the way teaching in years 7-9 is arranged in most schools. What about teaching in sixth forms of Years 12 and 13?

Percentage of hours taught by teachers with qualification for ‘Subjects taught and Specialist teachers and hours’ for Years 12 to 13, Chemistry, PGCE, PGDE, ProfGCE, or ProfGDE, Physics and Qualified teacher in England between 2020/21 and 2025/26

Chemistry

2020/21 52.6%

2024/25 49.5%

2025/26 49.1%

Physics

2020/21 52.4%

2024/25 49.4%

2025/26 47.4%

I find this decrease disappointing.

Overall, there is some way to go to meet the manifesto wording, and with static rolls and funding for schools likely to be challenging, I wonder whether the proliferation of small sixth forms is helping or hindering the teaching of these subjects. Perhaps the DfE can identify whether there is any link between the sixth of sixth form groups and the qualifications of those teaching Years 12 and 13?

Demand for music teachers: where were the jobs in early 2026?

This post follows on from my previous post, written yesterday, and looks in more detail at the vacancies for music teachers tracked since January 1st 2026. Music teachers: labour market update | John Howson

Due to further data cleansing, the numbers may slightly differ from yesterday in some respects after mis-allocations in certain fields have been corrected.

Vacancies are generally either for a main scale/Upper Pay Spine post or for a promoted post.

In terms of the ratio of promoted posts with a TLR, or in a few cases a Leadership Scale offer, to posts without any additional allowance, the East Midlands region tops the list at 37% of advertised posts with a TLR.  At the other end of the scale, no promoted posts have been recorded for the North East. It may be that schools in the North East use regional job boards for promoted posts. Those boards are currently out of scope of my survey.

The East of England region also had a lower-than-average percentage of promoted posts in the total of advertised vacancies. However, this may be partly due to the larger than average number of posts advertised without any additional pay supplement dragging down the percentage of promoted posts.

Most promoted post are TLRs advertised as a 2b.

In terms of the need to re-advertise vacancies for teachers of music, there are three clear regional groups: the East Midland and East of England with well above average levels of schools re-advertising; Yorkshire and The Humber region where, to date, no re-advertisements have been recorded, along with the West Midlands, North East and South West, regions with well below average levels of re-advertisements.

The remaining regions have re-advertisement rates broadly in line with the national average. Of course, there is still time for other schools to re-advertise before the end of the summer term. However, as they would only be attracting ITT completers or returners, this might be something of a futile exercise, only worthwhile if at no cost, such as using the DfE vacancy website.

Interesting questions that arise from the data are: how well does ITT provision map with demand and are there any characteristics of schools that re-advertise vacancies – high free school meal percentages; excellent music departments; high-cost housing areas; long distance from ITT provision no recent history of schools being used by trainees?

Other interesting questions to research include: the balance of full-time versus part-time vacancies and between permanent and temporary vacancies; and how many of the latter are as a result of a teacher taking maternity leave? Fortunately this data has been collected along with whether or not the school is an academy and if the post is eligible for visa sponsorship: most are not.

If I have the time, I will try and address some of these questions in the round-up after the end of the summer term in August. Meantime, any views would be welcome in the comments section.

Music teachers: labour market update

One of the leitmotifs of this blog has been around the labour market for teachers, from numbers entering training, through vacancies for teachers, to the numbers of teachers that are in-service.

This academic year, I have been tracking the data on vacancies for headteachers – a study started more than 40 years ago – and vacancies for teachers of music. This is as a part of my campaign to see the bursary returned to trainee teachers of music, after the Labour government axed it an act of cultural vandalism that I might have expected from other political parties, but not from Labour.

Anyway, enough of my rant. Does the data support my thesis that there are not enough music trainees this year, even with the bursary, and that any reduction in trainee numbers will affect the 2027 labour market, making it more difficult for schools, and especially secondary schools in challenging circumstances, to recruit music teachers? For earlier discussions on this point see:  Music teachers: bring back the bursary | John Howson and Reviving Music Teacher Bursaries: A Necessity | John Howson

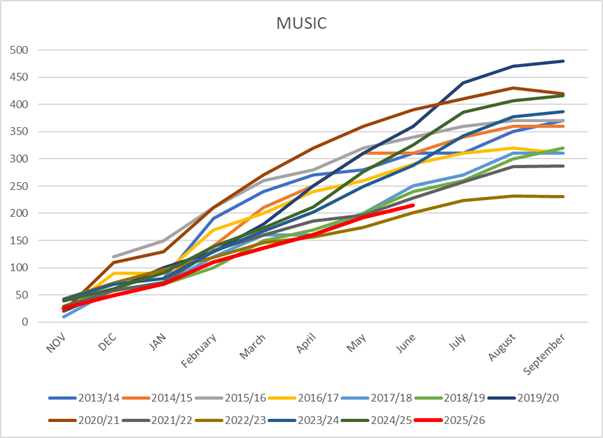
The graph in this post shows recorded 2026 vacancies for main scale teachers of music (no TLR) advertised since the start of January2026, and recorded from both the DfE vacancy site and the tes job board. The 2026 data have been plotted against previous years data, collected by TeachVac from school websites and local authority job boards.

The plotted line is the residual, reached after subtracting the recorded vacancies from number of trainees contained in the DfE’s ITT census published in the December 2025. By Friday 29th May 2026 the residual number had just turned negative; meaning more vacancies recorded than trainees possibly available to enter the labour market.

Two caveats are required at this point: not all trainees will complete their course, and of those that do, not all will enter teaching in state schools – some with not teach, others will teach in Sixth Form Colleges, and yet other will teach in the independent sector that now comprises a significant proportion of ‘A’ Music level entries. The second caveat is that in addition to trainees, there will be other entrants into the music teacher labour market. Some other entrants will be switching schools, but possibly most will be doing for a teaching job with a TLR. Then there will be those returning to state school teaching either from other jobs or a career break. This group will become increasingly important for the job market as the rest of 2026 unfolds, and the new entrants into teaching either find a teaching post in a state school of opt to work elsewhere.

For various reasons TeachVac stopped collecting data in 2023, so the data for 2024 and 2025 is missing. Comparing 2026 with earlier years, shows a trend worse than before covid, but better than in 2022, and the disastrous 2023, when poor recruitment into ITT in 2022 and the number of new schools opening in response to the increase in the secondary school population ensured a higher-than-normal demand for teachers. However, here was my analysis in June 2023 TeachVac’s index shows depth of teacher recruitment crisis | John Howson

For the current market outcome, if you discount the ITT 2025 census total by either 10% or 20%, for numbers in the census not likely to enter mainstream school teaching in the secondary sector, then the current negative residual at the end of May 2026, of -5, worsens to either -41 or -78.

This number assumes that vacancies tracked cover the whole market and that regional or other job boards, such as within large MATs, that are not counted in my survey have not seen many vacancies not placed on either the DfE or tes site.

Some schools may have offered trainees working in their schools a job, and saved on advertising costs. However, without more detailed surveys, such jobs would be difficult to account for.

One issue overcome by direct verification of the DfE and tes sites, is the thorny question of re-advertisements and repeat advertisements. The data used in this report ignores any second or subsequent advertisement by a school for a teacher of music unless it is significantly different to any previous advertised vacancy. Examples include a part-time post when the previous vacancy was for a full-time teachers and a maternity leave temporary post following one for a permanent appointment.

In a future post, I will look into the characteristics of schools that have re-advertised a vacancy.

After weighing the data on vacancies so far, and trends in ITT recruitment – see More thoughts on the ITT round for 2026 | John Howson – I think the removal of the bursary by the DfE was a risk, and that it may damage the future of music in state secondary schools in the future. I look forward to being proved wrong.

Are there now two classes of NEETS: traditional and Modern?

Most of the comments about yesterday’s report on NEETs (not in Education, Employment or Training) Young people and work: interim report – GOV.UK by Alan Milburn,  focused on the outcomes, especially the rising percentage of NEETs in the population. Fewer commentators delved deeper into the report to look at some of root causes that are likely to increase the chances off someone becoming a NEET.

I think there are now two groups of NEETs. The long-standing group, discussed below, and a newer second group of university graduates, unemployed or underemployed by age 25. This second group requires different approaches to the first group, but could be disproportionally affected by the increasing importance of AI in the labour market, and especially the loss of entry level jobs that is akin to the loss of manual labour jobs over the past half century. I will reflect upon this issue in another post.

For the first group, the following extracts from yesterday’s Report once again tell us everything we need to know: fail early, fail often.

4.2 Early years: where the trajectory begins

302. The system knows, from the moment a child arrives at school, who is most likely to fail. It has the data, and the unambiguous evidence. A study of over 8,000 young people in Bradford found that children who were not school-ready at ages 4 to 5 were nearly three times as likely to be NEET at ages 16 to 17 years old. 11% of those who did not reach a Good Level of Development at reception were later NEET, compared with just 4% of those who did.[footnote 273] Research tracking children from school entry through to their late teens shows that most of this effect operates through academic attainment.[footnote 274] A child who falls behind at 5 years old is on average still behind at 16 years old. Missing early building blocks propagates forward through every key stage. Around 65% of the relationship between school readiness and later NEET status runs through this academic pathway.[footnote 275]

4.3 Schooling

The attainment gradient

309. Taken on its own terms, much of the schools system looks relatively strong. In England, those aged 15 perform above the OECD average in reading, maths and science.[footnote 287] Level 2 attainment in English and maths by age 19 reached 76.1% in 2023 to 2024, the second highest on record,[footnote 288] although it has fallen back slightly to 73.2% in 2024 to 2025.[footnote 289] Those aged 16 to 19 score above the OECD average in literacy and adaptive problem solving, with significant improvements in literacy and numeracy since 2012.[footnote 290] Only around 5% of non-disadvantaged young people fail to enter a sustained destination after Key Stage 4.[footnote 291]

310. And yet the relationship between social background and educational attainment in England is unbroken. It has survived every reform of the past three decades. Disadvantaged children still perform substantially worse at every stage of education. The gap does not close as children move through the system. It widens.

311. At age 7, the most disadvantaged pupils are 16 percentiles behind their most advantaged peers. By age 18 or 19, the same young people are 29 percentiles behind.[footnote 292] 12 years of schooling, and the gap has nearly doubled.

312. The damage begins early and locks in at primary school. At Key Stage 2, just 47% of disadvantaged pupils reached the expected standard in reading, writing and maths, compared with 69% of their peers, a 22 percentage point gap.[footnote 293]

313. Primary schools do not receive the same level of attention in the public debate on education as secondary schools.  Perhaps that is why the ambitions that have been set for primary school children are surprisingly low.  On the face of it, it is astonishing for example that successive governments have set targets for primary schools to only have 75% of their pupils leaving with the age-appropriate level of numeracy and literacy skills.  In other words, the State assumes that one in four will never achieve that standard.

As I wrote about an earlier Social Mobility Commission Report, Education counts, but so does the family | John Howson

[This report] “raises a number of interesting questions. Most are not new, but they are none the worse for restating.

Life changes, at least as far as incomes are concerned, seem to be a combination of education, local labour markets, soft skills and parental ability to offer support for life chances.” John Howson Blog 15th September 2020

We have also known for a long time the importance of ‘soft skills. Here is an extract from my blog written after an earlier Social Mobility Commission Report

In 2009, I concluded that ‘the activities relating to having fun and socialising are the key activities of out-of-school activities.’ The Social Mobility Commission chairman has concluded that

“It is shocking that so many children from poorer backgrounds never get the chance to join a football team, learn to dance or play music. The activity either costs too much, isn’t available or children just feel they won’t fit in. As a result, they miss out on important benefits – a sense of belonging, increased confidence and social skills which are invaluable to employers. It is high time to level the playing field.”  Blog July 19th 2019 The importance of soft skills and those that miss out | John Howson

Even earlier, after a Social Mobility Commission of 2017, I commented that

“Of most concern in the report is the fact that there is still general acceptance that educational opportunity is still shaped by background, with those from poor backgrounds having least opportunities and that the level of opportunity deteriorates between school and university.” June 15th 2017  Class rules: not OK | John Howson

Go even further back to 2014, and an early post on this blog commented about social mobility that

“The Commission also discuss parental involvement and the poor quality of career advice that is often linked to low expectations. More must be done to encourage parents that the education system failed not to let the same thing happen with the next generation. Breaking the cycle of hopelessness is a vital component to raising standards as the Commission acknowledges. How to disseminate best practice rather than ritual nods to devolving training to schools and Teach First might have allowed for discussion about the content of both initial training and professional development of teachers.

Where I do agree with the Commission is in the vital role played by primary schools and the need to focus more attention on success in the early years. Regular attendance and strategies to help pupils that miss school are important moves in helping all pupils achieve success as last week’s publication of the EYFS profiles showed.

For anyone interested in the issue of social mobility this is an important but at times challenging and even depressing Report to read. It can be found at” https://www.gov.uk/government/uploads/system/uploads/attachment_data/file/364979/State_of_the_Nation_Final.pdf

 Blog post 21st October 2014.

So, way back in 2014, much the same comments were being made as in Section 4.2 of the current report, quoted at the start of this post.

We have a lost generation after what happened to those in early years after 2014, including and the slaughter of the Children’s Centres, the banishment of vocational skills from the curriculum, and a decade of teacher shortages leaving many disadvantaged pupils floundering at school in a system that was more interested in tacking organisation issues than creating a school system for all.

Sir John Newsom must be turning in his grave. Half Our Future: A tribute | John Howson