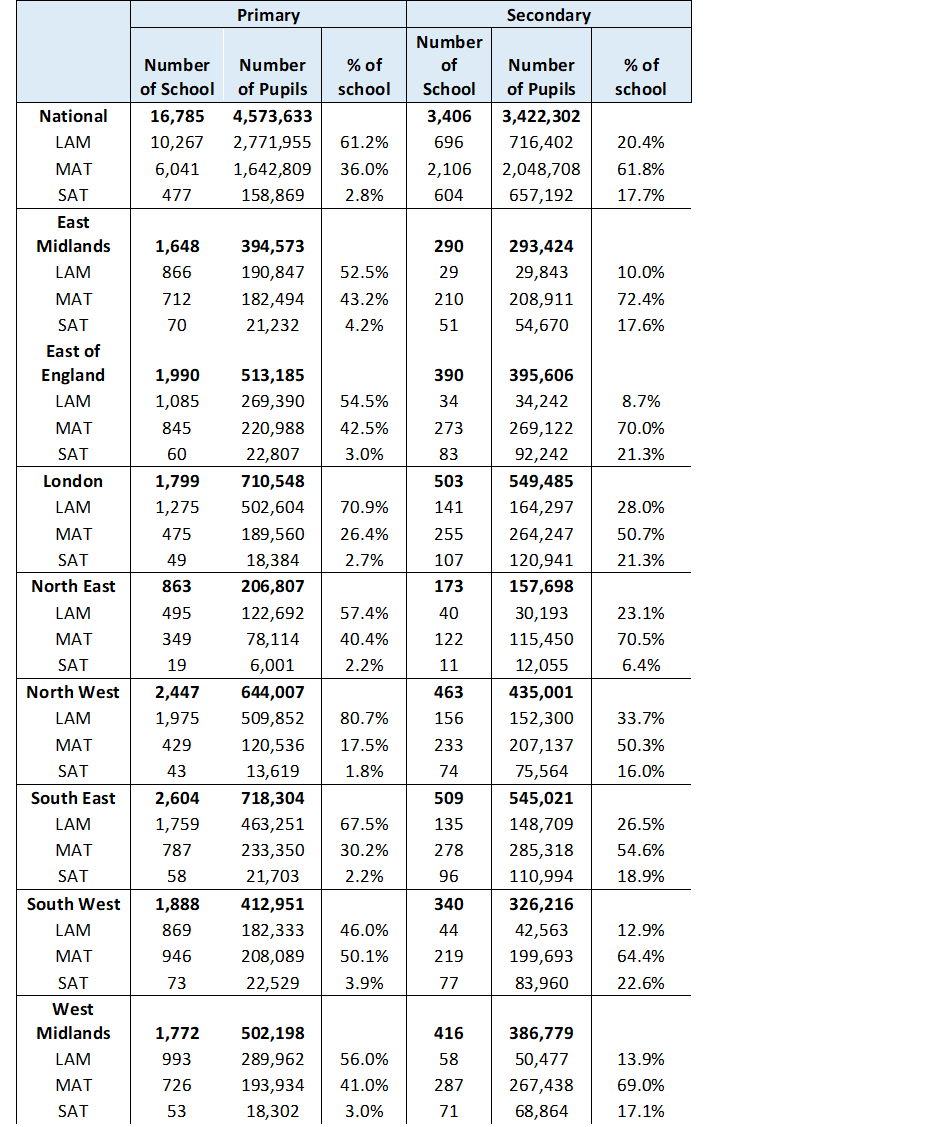
While academisation, whether Stand Alone academies (SAT) or schools in multi-academy trusts or committee (MATs) has taken hold in the secondary sector, the majority of primary schools are still not academies.
Governance
Primary
Secondary
Primary schools
% of primary schools
Secondary schools
% of secondary schools
All schools (state-funded)
LA maintained
10,615
63%
747
22%
MAT
5,675
34%
2,050
59%
SAT
501
3%
661
19%
Of which faith schools
LA maintained
4,215
68%
218
35%
MAT
1,777
29%
293
47%
SAT
192
3%
117
19%
Source: DfE
According to the DfE figures, 63% of primary schools are still LA maintained schools and that increases to 68% of faith schools despite some diocese having created local MAT/MACs. However, the vast majority of secondary schools are now academies of one sort or another.
However, a third of faith schools in the secondary sector are not yet academies. It would seem that it is the diocese rather than the local authorities that the DfE should be talking to about how to reach an all-academy school system.
There are also clearly regional differences, with primary schools in the North West still largely LA Maintained schools whereas only eight per cent of secondary schools in the East of England are not academies.
These differences are important in relation to issue such as in-year admissions, a topic this blog has pursued for several years now. I hope the difference arrangements between maintained and academies will be addressed in the Bill before parliament.
The Schools Bill, (no apostrophe) foreshadowed in the Queen’s Speech, has now been published as a House of Lords Bill. This means that the legislation starts in the House of Lords before then progressing to the House of Commons rather than the other way around. This isn’t unusual when there is a heavy legislative schedule. For instance, the 2003 Licensing Act started life as House of Lords Bill Schools Bill [HL] (parliament.uk)
The government has issued a set of notes and policy explanations for each section of the Bill Schools Bill: policy statements – GOV.UK (www.gov.uk) Key sections are on Academies, funding and attendance. The Bill is very technical, and looks in its initial iteration to be sorting out some oversight issues to ensure a national education system with minimal democratic involvement, just like the NHS.
I especially like Clause 3
3 Academies: power to apply or disapply education legislation
(1) The Secretary of State may by regulations provide—
(a) for any relevant provision to apply to an Academy (or to a type or 5 description of Academy) as it applies in England to another educational institution, subject to any prescribed modifications;
(b) for any relevant provision which applies in England both to an Academy and to another educational institution not to apply to, or to apply subject to prescribed modifications to, an Academy (or to a type or description of Academy).
There are some exceptions listed, but this is the sort of sweeping power for the Secretary of State that used to worry parliamentarians.
Part Three of the Bill is about School Attendance, and will no doubt carry much of the discussion at the Second Reading next week. The argument revolves around child safeguarding and children’s rights to education versus the right of a parent to decide the education of their child or children. The Bill doesn’t go so far as to require schooling, but it does seek to tighten up knowing what choices parents have made for their children’s education. The establishment of a register may raise questions for the traveller community.
Sadly, despite appearing in the past two White Papers, I cannot find anything in the Bill about the return on in-year admissions to local authorities. I hope someone may decide to put down an amendment to Section Three to include this provision, not least for the benefit of children taken into care requiring a new school, and those with an EHCP that move into an area with limited special school places.
Even if the government can argue that there are regulations to cover the change, it would still be better on the face of the Bill.
Following the decision on a National Funding Formula, I am not sure what role Schools Forums will play in the future, and whether headteachers will take them seriously anymore?
The Chief Inspector will now be able to ask a Magistrate for an entry warrant in certain circumstances. Along with the provisions for regulation of independent education establishments this continues the theme of protecting children, but some may see it as heavy-handed from a Conservative government. The debate next week will make for interesting reading in Hansard.
As the 26th May and ‘Thank a Teacher’ Day draws nearer I have looked at TeachVac statistics for vacancies in 2022 up to the 10th May compared with the vacancy number for the whole of 2019, the last full year before the pandemic. The statistics make for grim reading.
In seven areas, the total vacancies recorded so far in 2022 exceed the total recorded for the whole of 2019.
These include subject areas such as religious education and design and technology where there have already been more vacancies posted in the first four and a bit months of 2022 than during the whole of 2019. Grim news for any school looking for a September appointment and possibly a catastrophe for schools that will need to make an appointment for January 2023.
Interestingly, it is still the EBacc subjects where recruitment is less buoyant. In the case of maths, English and the sciences, vacancies are still adrift of the 2019 total by some margin. That doesn’t mean everything is great, even in these subjects because the vacancies are still close to the total for the pool of new entrants, especially once those trainees already committed to schools are excluded from the calculations.
So, ‘Thank a Teacher’ Day must also be ‘recruit a trainee into teaching’ day, week and month if we are going to continue to improve the education for all children wherever they live and whatever school they attend.
At TeachVac, we monitor trends at every level from geographical to phase and subject and career grade. Our reports provide invaluable intelligence to schools, MATs, dioceses, local authorities and others interested in the labour market for teachers. The reports are also the most comprehensive daily reports available.
There are still a couple of weeks to go to the resignation date at the end of May and so far, this week, TeachVac has recorded more than 2,800 new vacancies in the course of just two days. By the end of this week, the total for 2022 could be in excess of 55,00 or less than 9,000 behind the total for the whole of 2019.
The teaching workforce crisis doesn’t receive the same attention as the NHS crisis, but its effects are just as key to the nation’s health, welfare and economic prosperity. Sadly, there was no recognition in the Queen’s speech of the issues facing teacher supply. Rearranging the organisational structure of schooling by making all schools academies may be a solution, but don’t bet on it.
When design and technology is the only key subject recording more offers to would-be graduates wanting to train as a teacher in April 2022 than at the same point in the 2021 recruitment into training round, you know something unusual is happening.
Being charitable, one might ascribe the lack of offers to candidates to a combination of the timing of Easter this year and the imminent announcement when the data were collected of the 2022 ITT Training targets by the DfE. Apart from design and technology every secondary subject that I have been tracking since the 2013/14 round is recording lower offer numbers than in April 2021.
Of course, ‘offers’ defined as those in the ‘recruited’, ‘conditions pending’, ’deferred from a previous cycle’ and ‘received an offer’ don’t tell the whole story. Trends in applications are also a key barometer as they aren’t influenced so much by targets although Easter does affect when candidates apply, as does the forthcoming examination season for finalists that might not yet have applied to train as a teacher.
Applications to train as a primary teacher reached 31,925 by mid-April this year. The table shows how that number compares with recent years.
Applications
February
March
April
May
June
July
August
September
Primary
2016/17
37910
41530
44260
46720
49350
51590
53410
54310
Primary
2017/18
26430
30540
33810
38110
41180
44310
46900
48060
Primary
2018/19
24710
28670
32250
35850
38880
41790
44330
45490
Primary
2019/2020
23800
27870
31920
35990
40180
46180
46890
48670
Primary
2020/21
30240
35770
41020
44680
48530
51310
52940
54230
Primary
2021/22
23967
28391
31925
Source TeachVac from UCAS and DfE data
So, applications are in-line with pre-pandemic lows for April. As the data on courses with vacancies has revealed, (see my blog post on that topic) this is not enough to fill courses across the country and the government cannot take the primary sector for granted.
Overall applications to the secondary sector courses are a worry and the government should take notice.
Applications for Secondary Courses
March
April
May
June
July
August
2015
78580
87590
95160
101700
2016
81490
87580
93530
100000
2017
75850
82770
89550
97370
2018
59350
67390
78460
86790
2019
57860
66740
76360
84790
2020
57780
68310
79350
91100
2021
72830
84300
92160
100720
120070
122310
2022
61755
70253
Source TeachVac from UCAS and DfE data
Only in 2018 and 2019 were applications lower at this point in the cycle. Hopefully, the data for May will show closer to the 90,000 number that is required to provide sufficient choice in many subjects.
Overall, some 37% of applications – note applications not applicants – have resulted in some sort of ‘offer’. According to Table 10.1 in the DfE data the percentage for design and technology is over 40%, but even that percentage won’t be high enough to ensure the target in the Teacher Supply Model is met.
Ministers and their Aides may well want to reflect upon this data and its implications. Keeping fingers crossed that graduate unemployment might be on the rise and teaching looks like a safe bet in any economic downturn is one possible strategy, but at present it still looks like a gamble with the education of the nation’s children that has too risky odds. The data for May will be awaited with real interest.
Should a foreign owned company earn around £50 million from recruitment advertising largely paid for by schools located in England? I previously wrote about the published accounts of the tes a couple of years ago Teacher Recruitment: How much should it cost to advertise a vacancy? | John Howson (wordpress.com) This morning, Companies House published the TES GLOBAL Ltd accounts for 2020-21 covering the period up to the end of August 2021. The turnover in the UK of the Group was some £54 million; up from pre-pandemic levels of just under £52 million. Most of the income comes from subscription advertising, where schools pay the company an annual fee. Transactional advertising income continued to form a much smaller part of the company’s turnover.
Now, as regular readers of this blog are aware, I am not unbiased when it comes to the issue of recruitment advertising and the teacher vacancy market, having helped create TeachVac www.teachvac.co.uk well before the DfE started their job board.
There is an interesting question as to why schools are prepared to use TeachVac and the DfE site, but still pay shedloads of cash to the owners of the tes job board? For some it will be just inertia: nobody ever got fired for using the established player in the market. For some it will no doubt be a belief that tes has more teachers looking for vacancies than any other platform. TeachVac requires registration, so we know a lot more about our active job seekers than job boards that don’t require a sign-up. Interestingly, there seems little data in the tes accounts about usage of their platform by teachers. TeachVac regularly publishes data on matches, having passed the one million for 2022 earlier this week.
TeachVac has been dedicated to prove the concept that job boards don’t need to be expensive, and its current pricing model of £1 per match up to a maximum of £1,000 per school per year for secondary schools, and less for primary schools, is much cheaper than a subscription to tes.
Interestingly, tes has admin expenses of around £60 million, not all spent on the recruitment side of the business. However, it is vastly more than the £150,000 TeachVac costs to do a similar job of matching vacancies to job seekers. With the possibility of 75,000 vacancies on TeachVac this year, that’s a cost of little more than £2 per vacancy for TeachVac, compared with perhaps £4-500 per vacancy listed by the tes extrapolating from the information in the published accounts. This despite the company further reducing its headcount from 191 to 160 at the end of the accounting period.
In their accounts, tes’s owners cite software and development costs of £43,000,000. I wonder what that values that places on TeachVac’s software when we come to do our annual accounts later this year?
Overall, TES GLOBAL Ltd has returned to losses in 2020-21, after a profit in the year before, when they sold their teacher supply business. The company still has a large interest burden effectively being serviced by schools.
The question, as ever, is, how long will schools be prepared to pay these prices for recruitment advertising when cheaper options are available?
Two thirds of ITT courses offering psychology via the DfE website no longer have vacancies. Nearly half the courses training teachers in Latin, and four out of ten of the physical education courses also no longer have vacancies, as of 4th May. That’s the good news.
At the other end of the scale, between 90-92% of the science courses still have at least one vacancy, with little difference between courses for biology, chemistry or physics teachers despite some generous incentives to teach the subjects. Most of the remaining courses have more than three quarters of courses still recruiting, including courses for primary school teachers.
This data is interesting because it reveals recruitment issues are widespread across England and not just confined to a few regions. If the latter was the case, then it would be likely that courses in some regions would be showing ‘no vacancies’ by now. Generally, that doesn’t appear to be the case except in psychology and the small number of other subjects were above average numbers of courses have no vacancies.
The next big challenge comes in June, when new graduates have to decide their future. Will the worsening economic outlook cause a recruitment bounce such as was seen in 2020 during the height of the first wave of the covid pandemic? Perhaps we will have to wait until 2023 before the labour market for graduates tightens sufficiently for graduates to turn to teaching.
Can we start to suggest that the longest period of teacher shortages might be drawing to an end with a spectacular array of unfilled places in 2022.
However, to really solve the teacher supply crisis, at least at recruitment into training of postgraduates, the profession has to look attractive to graduates, and the recent hike to more than 12% on loan repayments may well act as a deterrent. The outcome of this year’s STRB review of pay and conditions will also be crucial, as will be the willingness of the government to accept the Report.
The one good note for the government is the reduction in the size of the primary school population and thus, a likely requirement for fewer teachers in the next few years. This will especially be the case if the hard Funding Formula causes small schools to close in any numbers, making for more efficient class sizes.
Pupil numbers in the secondary sector will also level out, if not decline, in a few years’ time and that will also potentially take the pressure of training numbers for the secondary sector. However, if teachers continue to switch to tutoring or teaching overseas, then any decline in the need for teachers from a reduction in pupil numbers will be offset by a growing demand for other reasons.
In the meantime, persuading new graduates to select teacher training might be where the government can best spend its marketing budget over the next couple of months.
45,000 teacher vacancies were advertised so far in 2022. There were only 65,000 vacancies advertised during the whole of 2021, so demand in 2022 is much higher than in recent years. The pool of teachers to fill these vacancies has largely been exhausted, and secondary schools seeking teachers of most subjects, apart for PE, history, drama and art, will struggle to find candidates to appoint during the remainder of 2022 regardless of wherever the school is located in England.
The data, correct up to Friday 29th April was collected by TeachVac, the National Vacancy Service for all teachers. www.teachvac.co.uk The situation in terms of teacher supply at the end of April is worse than in any of the eight years that TeachVac has been collecting data on teacher vacancies.
Schools can recruit teachers from various sources, including those on initial teacher training courses where they are not already committed to a school (Teach First and School Direct Salaried trainees are employed by specific schools); teachers moving schools and the broad group classified as ‘returners’ to teaching. This last group includes that previously economically inactive, usually as a result of a career break to care for young children or elderly relatives, plus those switching from other sectors of education including further education or returning from a period teaching overseas.
In extremis, where schools cannot find any candidates from these routes, a school may employ an ‘unqualified teacher’. This year that may include Ukrainian teachers displaced by the war as well as anyone else willing to take a teaching post. This was the route that I entered teaching in 1971. Generally, such teachers need considerable support in the early stages of their careers.
Normally, the labour market for teachers is a ‘free market’ with vacancies advertised and anyone free to apply. Can such a situation be allowed to continue? The DfE should convene a summit of interested parties to discuss the consequences of the present lack of supply of teachers facing schools across England looking to recruit a teacher in a wide range of subjects.
On the agenda should be, the effect of a lack of supply on the levelling up agenda; the costs of trying to recruit teachers; how best to use the remaining supply of PE, history, art, drama and primary sector trained teachers to make maximum use of scare resources, and how to handle any influx of ‘unqualified’ teachers.
The data for geography teacher vacancies, not normally seen as a shortage subject, reveals the seriousness of the current position for schools still seeking to fill a vacancy for September 2022 or faced with an unexpected vacancy in the autumn for January 2023.
With recruitment into training for courses starting in September 2022, already under pressure the issue of teacher supply is not just one for this year. Unless teaching is made a more attractive career and steps are taken to ensure maximum effective use of the teachers available then some children’s education will be compromised and their future career choices put in jeopardy.
After 40 years of studying leadership trends this is an interesting set of data. The key results are shown in the table below.
Percentage of postholders that are new to post that have left within 5 years of appointment
Head teachers
Deputy heads
Assistant heads
Middle leaders
Primary phase
2011
22%
25%
26%
43%
2015
25%
26%
29%
46%
Secondary phase
2011
35%
32%
37%
43%
2015
37%
37%
39%
44%
Source: NAHT
The first thing to notice is that the data are expressed in terms of percentages. Taking just headteachers, as an example, in a typical year TeachVac records around 1,500 advertisements for primary headteachers, and 350-400 for secondary headteachers.
Using those numbers, the change would be from 330 to 345 departing in the primary sector between 20111 and those appointed in 2015, and in the secondary sector, assuming 400 vacancies each year – the upper end of the range- the change would be an increase of eight headteachers.
Since the press release didn’t calibrate the size of the market in each year, it isn’t clear whether more opportunities in the five-year period would have provided more leaders with a chance to move early in their careers. Certainly, the period from 2019 onwards has seen the start of the bulge in secondary pupil numbers and the creation of some new schools requiring new leaders. The period also witnessed the development and consolidation of Multi-Academy Trusts central staffing and some of those posts may well have been taken by school leaders in post for less than five years.
The press release also doesn’t make clear whether departures were tracked to see where the school leader went? If young leaders are quitting the profession, then that’s a serious situation, especially in the primary phase where there are fewer deputy headteachers and headteachers and any departures at that stage would be challenging to the sector.
As primary teaching, even at the more senior ranks, is now largely populated by women, the age profile of those leaving may also be worth exploring. Are some taking a career break for caring roles, and do we need a ‘keep in touch’ scheme for these leavers? Are there issues with certain types of school and does the data say anything to the levelling up agenda that might interest the STRB?
School leadership, whether at middle leadership or senior leadership levels is a challenging task and these percentages must be viewed with concern, but there is much more to discover from these percentages than might appear from the headline. However, that’s the aim of a good headline; to make one read the text that follows.
This is an interesting article written with the support of The Gatsby Foundation on the effect of special retention payments on keeping mathematics and science teachers in state schools Paying early career science teachers 5% more keeps significant numbers in the classroom | Education | Gatsby Personally, I wish researchers would not talk about teachers leaving the profession when they mean no longer working in stated funded schools. These teachers might be working in private schools, the further education sector or Sixth Form Colleges whose employees are not captured in the annual Teacher Workforce Survey.
My other concern with this interesting piece of research is the regional bias to the data. As a result of using specific payments rather than the generic use of retention payments, most of the areas surveyed are in either Yorkshire and The Humber region or in the North East of England. The latter region offers teachers few opportunities for transfer between schools due to the limited number of vacancies each year compared with other regions according to TeachVac data www.teachvac.couk .
The fact of reduced numbers of vacancies on offer might mask a group of teachers staying in state schools, but moving to a different school. In Constable et al (1999) a research report for the University of Northumbria on the supply of teachers of physics, the ability to teach ‘A’ level physics early in a teaching career was an important motivation for teachers, as was the opportunity to teach mathematics rather than the other sciences for physicists when not timetabled to teach physics.
In a part of the country, such as the North East, with relatively little other graduate opportunities, especially compared to say the London region where not only are they many private school vacancies but also a buoyant graduate market, it would have been interesting to review the cohort in this Gatsby funded research with say a similar cohort of Teach First trainees to review any differences in the economic benefits between classroom based salary supported training and post-training retention incentives.
Of course, keeping teachers in schools is only part of the battle. Such policies help the schools where these teachers work but do nothing for other schools suffering as a result of the overall shortage of teachers in say, physics. Do subject enhancement courses that attract more recruits have a better economic return or could perhaps retaining other science teachers or even mathematics teachers to teach physics be more cost-effective than offering higher salaries to those that have chosen to teacher physics. Understanding, as Constable et al tried to do, what motivates physics teachers either to stay or to leave ibn more general terms might help devise new policies to overcome teacher shortages.
Tracking expertise might also be helped if Qualified Teacher Status was tied to specific subjects and only temporary accreditation to teach a subject was granted to those without the appropriate training and subject knowledge. This might help keep better track of where shortages are to be found.
The full list of changes is shown in the table below
subject
number 21/22
number 22/23
difference
Total
31030
32600
1570
Primary
10800
11655
855
Total
20230
20945
715
Modern Languages
1505
2140
635
Design & Technology
1475
1825
350
Computing
840
1145
305
Others
1980
2240
260
Geography
745
945
200
English
1980
2100
120
Physics
2530
2610
80
History
780
850
70
Classics
40
30
-10
Religious Education
470
450
-20
Physical Education
1010
980
-30
Biology
820
780
-40
Drama
330
290
-40
Art & Design
580
530
-50
Music
540
470
-70
Business Studies
725
635
-90
Chemistry
1080
885
-195
Mathematics
2800
2040
-760
Source: DfE
As the DfE noted in their announcement ‘It is also important to note that recruitment to postgraduate ITT in 2022/23 has not been limited for any subject except physical education. Therefore, although targets for certain subjects may have decreased compared to last year, this does not necessarily mean there will be fewer trainees recruited as a consequence – recruitment can exceed targets.’
This statement, of course, raises the question of why have targets? The answer is complicated, and has been a matter for debate for many years. I assume that The Treasury wants some idea of both how the DfE will spent its cash on schemes it operates, and what the drawdown of student loans could be at its maximum. Both are legitimate questions for government to ask. For a number of years, I was part of a group that discussed these targets before they were released, in those days in the autumn as recruitment to the round was about to start. Now, I read them at the same time as everyone else.
The DfE commentary also notes that adjustments have been made for under-recruitment in certain subjects.
‘A key driver of whether the 2022/23 targets have increased/fallen for specific secondary subjects is the extent to which those targets have been adjusted to build in the impact of recruitment being below target in the two previous ITT rounds before 2022/23.
An example of a subject where such an adjustment has been made is modern languages. In the previous two ITT rounds, recruitment for modern languages was below target, so we have increased the 2022/23 target for modern languages to account for this previous under-recruitment. This is the first time we have made such an adjustment for the subject, leading to modern languages having the largest percentage increase in targets this year.
For some subjects, the impact of previous under-recruitment against targets can be offset by other factors. A good example of this is mathematics, where we have seen a decrease in the 2022/23 target compared to last year’s target. Whilst the 2020/21 and 2021/22 PGITT targets for mathematics were not met, the impact of this under-recruitment was more than offset by increases in the numbers of PGITT trainees, returners, and teachers that are new to the state-funded sector being recruited. Furthermore, there was an increase in the proportion of mathematics trainees entering the workforce immediately after ITT.’
This comment from the DfE suggests that retraining courses for serving teachers in subjects such as mathematics might now be considered when calculating targets. It would have been interesting to have seen the worked example for mathematics in order to see which of factors was important in reducing the total to a number close to that for English. Certainly, TeachVac has recorded lower demand for mathematics this year than might have been expected.
Interestingly, in the list of factors affecting the calculation of the targets, the DfE focus on factors affecting inflows. It is not clear the extent to which the changing global marketplace for teachers affects ‘outflows’ and whether any pause due to the effects of covid may have only been a temporary reduction in the number of teachers departing these shores?
The issue of including the effects of under-recruitment in the current targets is an interesting one. Schools start each September fully staffed, so there is a risk that by including the shortfall from previous years in the new target the supply is inflated to a point where a proportion of trainees won’t find a teaching post. It would be interesting to see if these are mostly likely to be trainees with student loans not training through an employer managed route. The DfE will have that data. Inflated targets can also lead to places being provided in parts of the country where there are not jobs. This was a consequence of using this methodology in the 1990s.
At the present time, this consideration of whether to include a previous shortfall in the current target is merely an academic discussion in most subjects, since 2022 will most likely again see courses fail to hit even these revised targets where they have been lowered, except perhaps in Chemistry and possibly mathematics, both subjects where over-recruitment is permitted.
However, the methodology used in calculating targets via the Teacher Supply model (TSM) process may become more important for providers in coming years as pupil numbers stabilise and funding comes under pressure, especially if large salary increases to cop with high inflation are not fully funded by government.
There will be tough times ahead in the ITT world. Will schools want to stay involved and what will be the collective views of Vice Chancellors towards the DfE and ITT?