
One of the government initiatives that I have just caught up with is the one around attendance and behaviour hubs. The DfE announcement in December when the programme was announced said that:
The regional improvement for standards and excellence (RISE) attendance and behaviour hubs programme is a national initiative designed to support schools in improving pupil attendance and behaviour.
Led by schools with strong practice, it aims to:
- support school leaders to reflect on current systems
- share effective practice
- implement changes
It is aimed at senior leaders with responsibility for attendance and behaviour who are seeking to strengthen their school’s leadership, culture and systems. RISE attendance and behaviour hubs programme – GOV.UK
Yesterday, the DfE updated the list of lead schools, so I took a look at these schools in the South East Region. Today’s list has five primary and five secondary schools as lead hubs.
The secondary schools are located in:
West Sussex
Milton Keynes
Medway
Slough
Portsmouth
Two of these schools are non-selective schools in a location with selective schools; four schools are under-subscribed, with the fifth school having 1150 pupils against a roll of 1058, and it is a faith school.
The five primary schools are located in
Kent – 2
East Sussex
West Sussex
Medway
All have at rolls of at least 400 pupils, although three of the schools are nowhere near their capacity.
How these schools will spread good practice across the region from Milton Keynes to the Isle of Wight and from Oxfordshire to Bracknell Forest will be an interesting challenge.
One option not open to them will be the device used in the Durham coalfield in the 19th century and recorded on the noticeboard of the school now housed in the Beamish Living Museum.
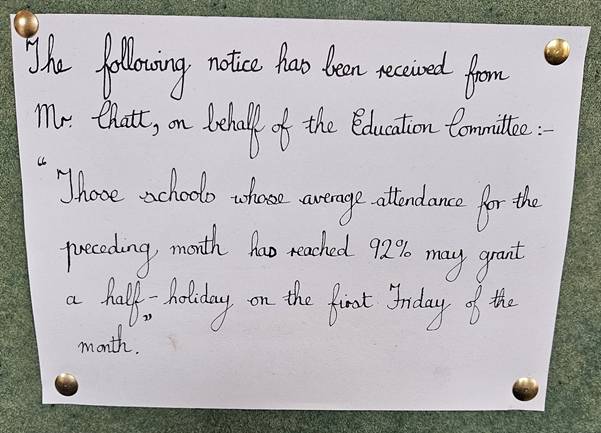
The notice reads
The following notice has been received from Mr Chatt, on behalf of the Education Committee: –
“Those schools whose average attendance for the preceding month has reached 92% may grant a half-holiday on the first Friday of the month.”
Looking at the DfE’s data for Oxfordshire, the average attendance from September 2025 to start of February 2026 was 95.1% for primary schools; 91.5% for secondary schools and 88.8% for special schools.
On the basis of that data some primary schools would have qualified for the half-day in at least one month. Possibly some secondary schools might have done so as well.
However, it is worth remembering that the schools receiving the notice were Elementary Schools, taking pupils from 5 to 13 or 14, depending upon the school leaving age at the time of undated message. Attendance by the older pupils was probably as much of a challenge in the 19th century as it is today; albeit for different reasons.
